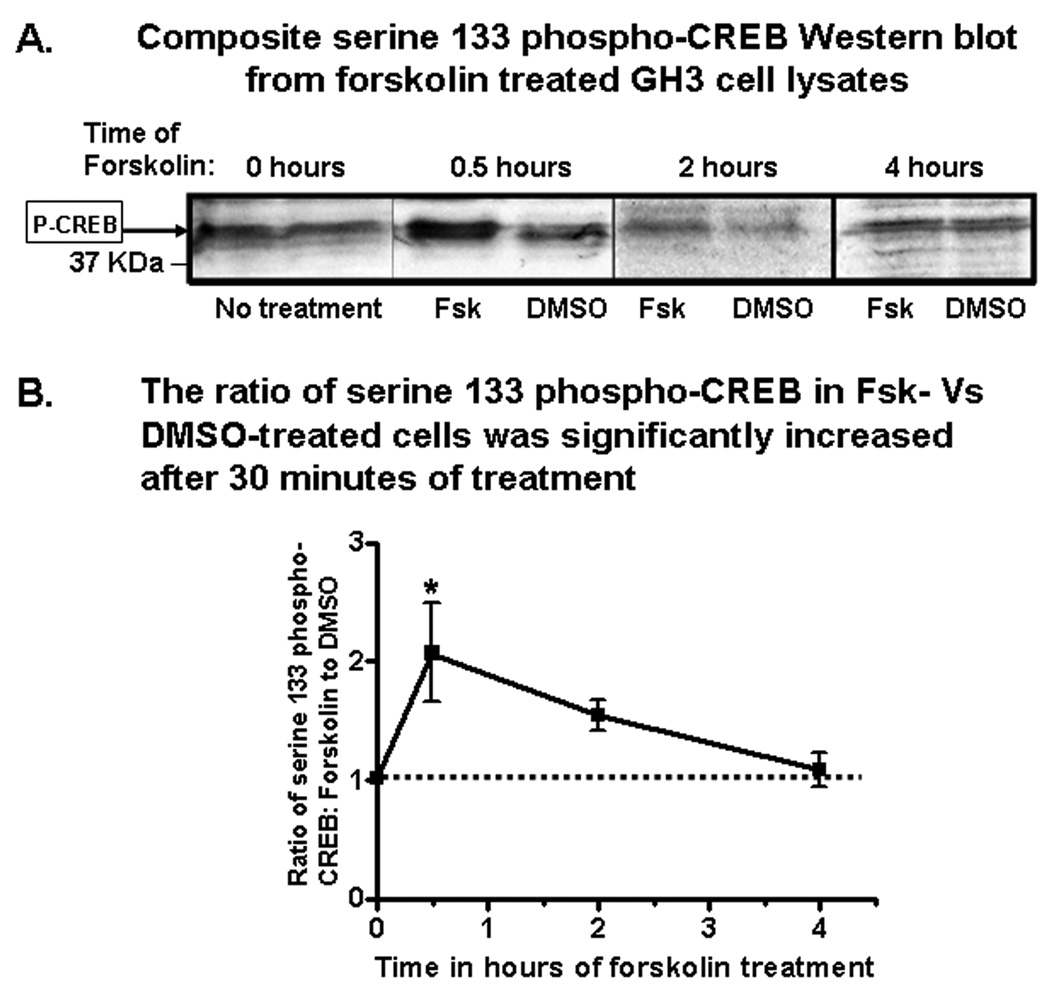
Figure 6. Forskolin time-dependently stimulated P-CREB levels in GH3 cells.
A) Shown is a composite figure of representative P-CREB Western blots from the lysates of paired plates of GH3 cells incubated with either 20µM forskolin or DMSO (vehicle). Immunoreactive P-CREB bands are indicated by an arrow in the left-hand margin of the panel. Blots from the different time points had different raw optical densities because of differences in exposure times. Thus, the ratios of forskolin to DMSO treated pairs of dishes at the individual time points were compared. The mean ratios of P-CREB levels in forskolin treated cells versus DMSO treated cells at different time points are presented graphically in panel (B) (n of 3–5 groups/time point). The asterisk indicates a significantly greater ratio. See text for additional details.

