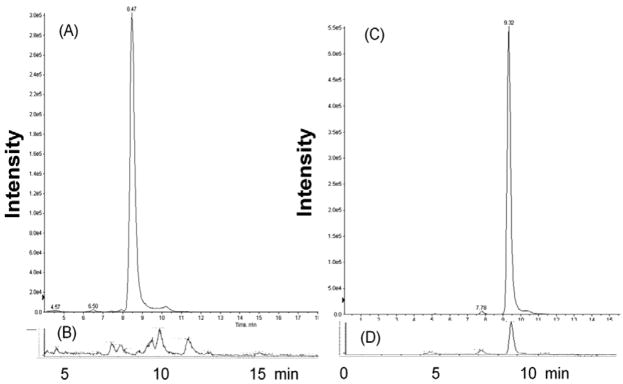
Figure 6.
LC–MS/MS analysis of free estrogen in cell culture supernatant after four days incubation of E2–BSA or 7EqCD. Positive ion electrospray selected reaction monitoring (SRM) chromatograms of estrogens as dansyl derivatives: (A) EE2 (70 nM) incubated in Ishikawa cell culture (peak intensity 3.0 × 10⁵); (B) 7EqCD (10 nM) incubated with Ishikawa cells (maximum y-axis intensity 1.4 × 10³) – EE2 peak was not observed above detection limits (<50 pM); SRM conditions EE2–dansyl·[MH+] m/z 530→171 collision energy 53 eV; (C) E2 (70 nM) incubated in Ishikawa cell culture (peak intensity 5.5 × 10⁵); (D) E2–BSA (1 μg/mL) incubated with Ishikawa cells (peak intensity 1.1 × 10⁴) showing approximately 1 nM based upon standard curves; SRM conditions E2–dansyl [MH+] m/z 506→171 collision energy 57 eV.

