Figure 2.
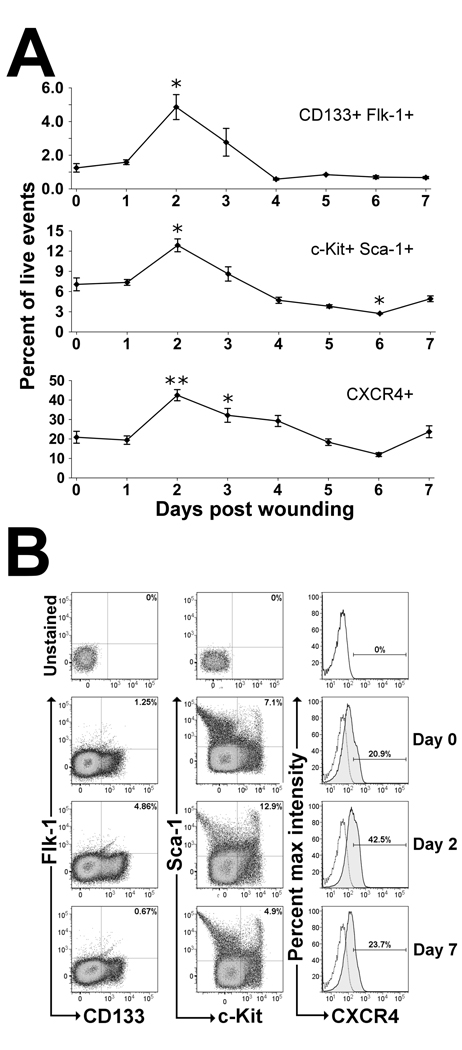
EPC surface markers found within the BM in response to cutaneous wounding in mice. (A) Flow cytometry was performed on BM cells flushed from femurs of non-wounded mice (day 0) and mice wounded at 1-day intervals ending at day 7. EPCs were quantitated as the percentage of cells staining positive for EPC surface markers per total live events (7-AAD−). Cutaneous wounding was found to cause a significant increase in EPC enriched populations (CD133+Flk-1+, Sca-1+c-Kit+, and CXCR4+) within the BM on day 2 following wounding. Values are means ± SEM with 3–5 mice per group. *P < 0.05, **P < 0.01 vs. control by Wilcoxen rank sum test. (B) Representative dot plot distributions and histograms from flow cytometric analyses of wounded and non-wounded mice. BM was flushed and stained with antibodies against EPC cell surface markers CD133, Flk-1, Sca-1, c-Kit and CXCR4 and analyzed using flow cytometry. Representative dot plots for both CD133+/Flk-1+ and Sca-1+/c-Kit+ cells and histograms for CXCR4+ cells show the gating strategy used for cell quantitation at days 0, 2 and 7 after wounding with unstained controls (top) for comparison. Unstained controls are shown as stippled lines within histogram plots. All panels shown are gated on live cells as determined by 7-AAD dye exclusion.

