Figure 4.
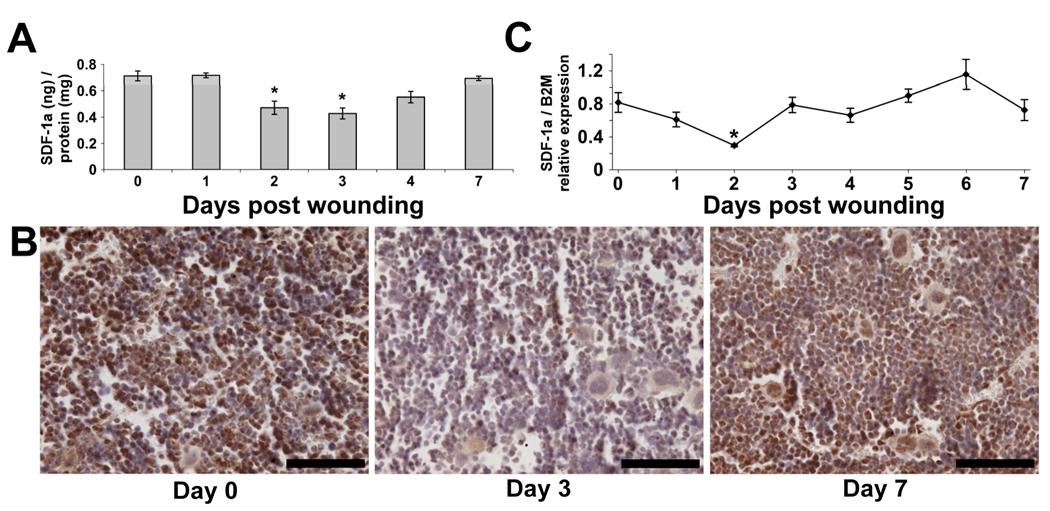
The effect of cutaneous wounding on bone marrow (BM) levels of SDF-1α. (A) Following total protein isolation from femurs of non-wounded mice (day 0) and mice post-wounding days 1–4 and 7, SDF-1α was quantitated using ELISA and normalized to total protein. Concentration expressed as nanograms (ng) of SDF-1α protein per milligram (mg) of total protein. Values are means ± SEM with 3–5 mice per group. *P < 0.05, vs. control by ANOVA. (B) Representative images of femurs from non-wounded mice and mice post wounding days 3 and 7 following immunohistochemistry for SDF-1α. Notice less detection of SDF-1α (brown) at day 3 compared to day 0. By day 7, the amount of SDF-1α appears to recover to non-wounded levels. Scale bars = 70 microns. (C) Relative expression of SDF-1α mRNA from BM of non-wounded mice and mice post wounding days 1–7. Messenger RNA was isolated from total femoral BM and quantitated for the relative expression of SDF-1α using real-time RT-PCR and normalized to beta-2-microglobulin. Values are means ± SEM with 3–5 mice per group. *P < 0.05 vs. control by ANOVA.

