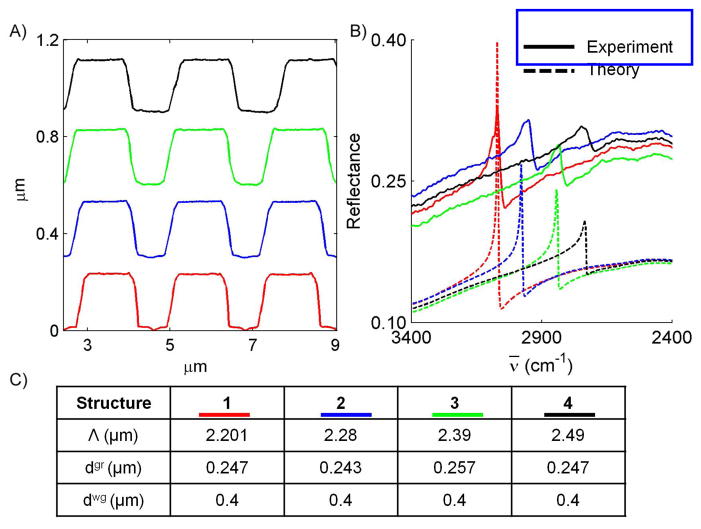
Figure 9.
A) Structure of the grating layer obtained for the four structures using AFM, (depicted offset from each other here). The AFM results are averaged over 256 scan lines. The structure of the grating layer is used to evaluate Λ and dgr, the standard deviation of dgr is ≤ 0.005 μm and the standard deviation in evaluating Λ is ≤0.015 μm. B) The reflectance efficiencies of the four filters with TM-polarized normal incidence, an appropriate dwg is found with which results predicted by RCWA match those obtained from experiments. C) Structural parameters for the four filters fabricated.

