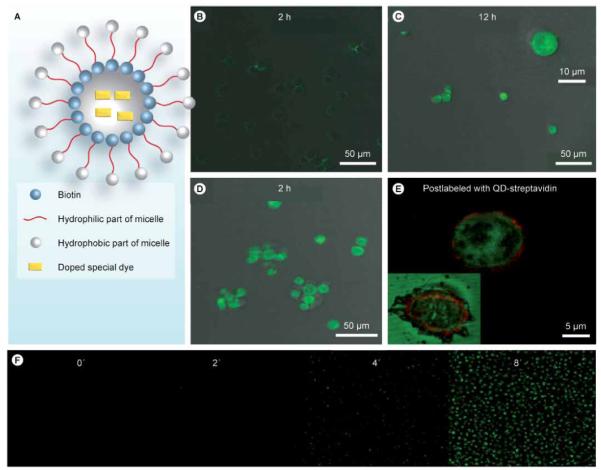
Figure 8.

(A) Design scheme of dye-doped micelles. Fluorescent images of Ramos cells for (B) 2 h and (C) 12 h, or incubation with the biotin–TDO5–micelle for (D) 2 h. (E) Enlarged fluorescent image after postlabeling the biotinylated TDO5 aptamer with QD705 streptavidin. The inset is the fluorescent image of the dead cell. (F) Real-time monitoring of doped special dyes released from the core of the micelles and activated by intracellular enzymes.
Adapted with permission from [44] © National Academy of Sciences, USA (2010).
