Fig. 2.
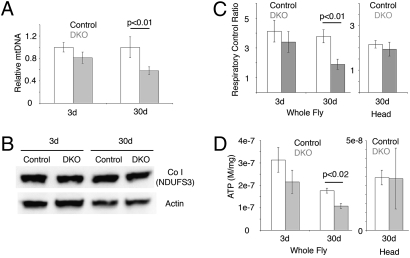
Mitochondrial dysfunction in DKO mutant flies. (A) The relative level of mtDNA in young (3 days) and old (30 days) control (white) and DKO (gray) thoraces (mean ± SEM, three DNA extractions for 3 days, four for 30 days). The ND5 locus was used to measure mtDNA levels, normalized to the nuclear let-7 locus. P = 0.0055 (t test, two tailed). (B) Western immunoblot for level of complex I subunit NDUFS3 (Upper) and actin shows similar levels in control and DKO with age. (C) Mitochondrial RCR of control (white) and DKO (gray). (Left) Whole flies (mean ± SEM, three preparations of mitochondria for 3 days, four for 30 days) (two-tailed t test, P = 0.005 between 30-day control and DKO samples). (Right) Heads (mean ± SEM, seven preparations of mitochondria). Mitochondrial RCR showed significance in aged whole fly and a modest but insignificant decrease in aged heads RCR (two-tailed t test, P = 0.096 between 30-day control and DKO). (D) ATP levels (mole/mg) of control (white) and DKO (gray) flies (mean ± SEM, three sample preparations) (two-tailed t test, P = 0.011 between 30-day control and DKO samples from whole flies).

