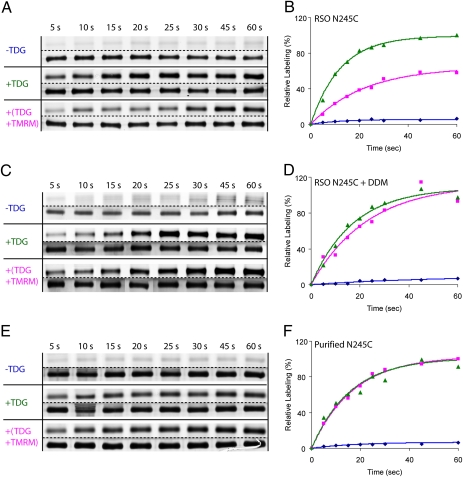
Fig. 2.
TMRM labeling of periplasmic N245C single-Cys LacY. (A and B) TMRM labeling in RSO membrane vesicles. (C and D), TMRM labeling in RSO membrane vesicles after addition of 2.0% DDM. (E and F), TMRM labeling of purified protein in DDM. Samples were incubated with 40 μM TMRM (A–D) or 4 μM TMRM (E and F), for the times indicated at 0 °C in the absence of sugar (−TDG; blue ◆), were preincubated with TDG (+TDG) for 10 min before addition of TMRM (green ▲), or TMRM and TDG were added simultaneously [+(TDG+TMRM); pink ■]. Samples then were subjected to minipurification with monovalent avidin, and the TMRM-labeled proteins were subjected to SDS/PAGE and assayed for fluorescence (lanes above dotted lines) and protein (lanes below dotted lines). The data then were treated semiquantitatively as described in Experimental Procedures by setting the 60-s point in the presence of TDG to 100%. Although not shown in A or B, when valinomycin (10 μM, final concentration) and nigericin (0.1 μM, final concentration) were added, no significant deviation from the pink curve (pink ■) shown in A was observed.

