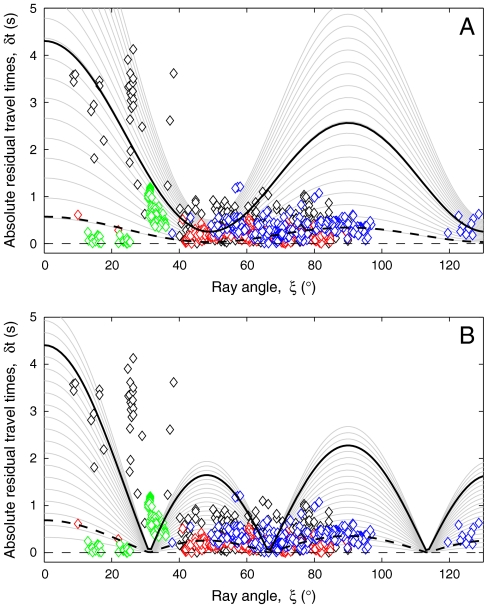
Fig. 3.
(A) Absolute PKiKP-PKIKP differential travel-times (|δt|) as a function of ray angles for a cylindrically averaged bcc aggregate ( ). The solid gray lines show the Transversely Isotropic Model curves, where the t parameter ranges between 7.799 and 123.234 s, so as to cover the entire interval of observed epicentral distances (Δ = 125°–150°). The shallower (deeper) curve refers to a PKIKP ray path that has the smallest (largest) travel time inside the inner core. The blue (red) open diamonds show the same eastern (western) differential travel-time data of Fig. 1. The polar African anomalies (46) and the datasets of Creager (8) and Song and Helmberger (59) are also shown as green and black open diamonds, respectively. Recall that the ray paths analyzed in refs. 8 and 59 turn at ∼100–300 km beneath the Earth ICB and are centered near Δ = 150°. The solid (dashed) black lines are the predicted travel-time anomalies for Δ = 150° (Δ = 130°) when considering 50% (25%) of the Fe-bcc crystals aligned along the Earth’s spin axis. (B) Absolute PKiKP-PKIKP travel-time residuals versus ray angles for a cylindrically averaged hcp aggregate. The solid gray lines are referring to the transversely isotropic hcp model, and the seismic datasets are the same as in A. The solid (dashed) black lines are the predicted absolute δt anomalies for Δ = 150° (Δ = 130°) when considering 85% (50%) of LPO for the Fe-hcp crystals.

