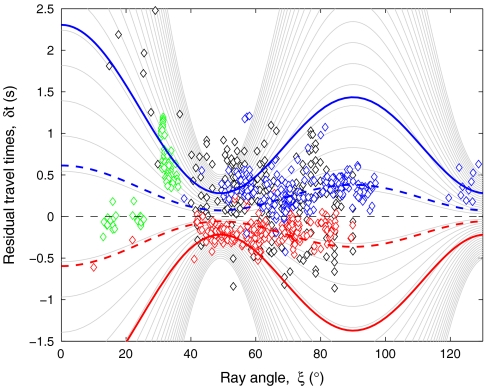
Fig. 4.
Plot of PKiKP-PKIKP travel-time anomalies as a function of ray angles for a bcc polycrystalline aggregate. Note the specularity between the eastern and western hemispherical patterns. Solid gray lines show the anisotropy pattern predicted by the transversely isotropic model for both eastern (blue open diamonds) and western (red open diamonds) hemispheres. We used the same t parameter range as in Fig. 3, as well as the same seismic observables. The solid (dashed) blue lines are the predicted eastern travel-time anomalies for Δ = 150° (Δ = 130°), when assuming 25% of LPO for iron bcc and a hemispherical velocity correction of +0.056 km/s. The solid (dashed) red lines indicate the computed western anomalies for Δ = 150° (Δ = 130°) at 25% of LPO and with μhem = -0.034 km/s.

