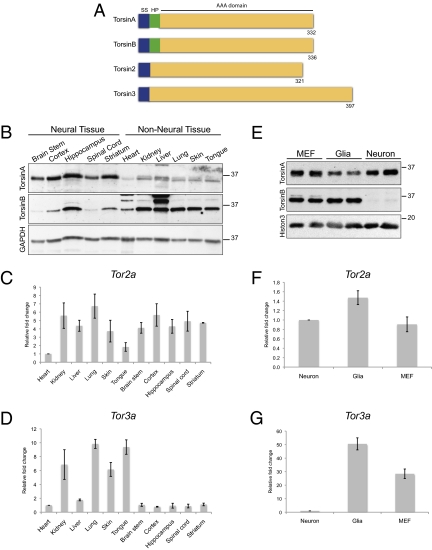
Fig. 3.
Torsin family members exhibit distinct expression patterns in neuronal and nonneuronal cells. (A) Cartoon diagram illustrating the torsin protein family. The key features of torsinA, torsinB, torsin2, and torsin3 are shown, including the signal sequence (SS; blue), hydrophobic domain (HP; green), and AAA domain (yellow). The number of amino acids is indicated for each protein. (B) The expression patterns of torsinA and torsinB proteins are opposite in neural and nonneural whole tissue. Levels of torsinB protein are clearly higher in nonneural tissue, whereas levels of torsinA protein are generally higher in neural tissue. Whole tissue protein lysates from E16 wild-type embryos probed with anti-torsinA (Top), anti-torsinB (Middle; 34 kDa), and anti-GAPDH (Bottom) antibodies. The E16 time point was chosen because this is the age when nuclear membrane blebs begin to form. (C) Levels of Tor2a mRNA are similar in neural and nonneural tissue. Quantitative RT-PCR was performed using RNA derived from E16 wild-type embryos. Ct value of Tor2a in each tissue was normalized to the Ct value of GAPDH. Relative fold change was obtained by comparing the normalized Ct value for a designated tissue to the one for heart. Error bars = SEM of fold change from three independent experiments (n = 3) performed on tissue derived from three independent sets of mice. (D) Levels of Tor3a mRNA are markedly higher in nonneural tissue than in neural tissue. Quantitative RT-PCR was performed as in C. (E) Neurons express markedly less torsinB protein than nonneuronal cell types. Whole cell protein lysates from primary cultures of wild-type MEFs, glia, or cortical neurons probed with anti-torisnA (Top), anti-torsinB (Middle), and anti-histone 3 (Bottom, loading control) antibodies. (F) Neurons and nonneuronal cell types express similar levels of Tor2a mRNA. Quantitative RT-PCR was performed using RNA extracted from primary cultures of wild-type MEFs, glia, or cortical neurons. Ct value of Tor2a for each cell type was normalized to the Ct value of β-actin. Relative fold change was obtained by comparing the normalized Ct value for a designated cell type to the one for neurons. Error bars = SEM of fold change from three independent experiments (n = 3) performed on cells derived from three independent sets of cultures. (G) Neurons express markedly less Tor3a mRNA than nonneuronal cell types. Quantitative RT-PCR was performed as in F.

