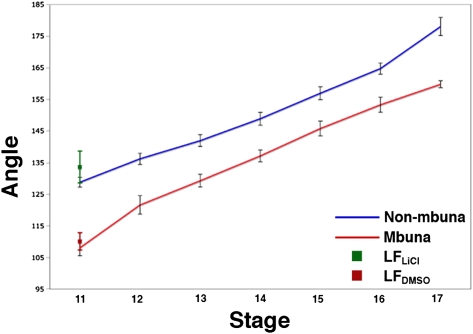
Fig. 3.
The angle of the signaling boundary ZLI impacts brain regionalization during neurogenesis and growth. The graph presents the average ZLI angle (± 1SD; between two and five specimens per species per stage; n = 120) over seven ontogenetic stages for nonmbuna CB, MC, and AJ (blue) and mbuna LF, MZ, and CA (red) (also see Fig. S4). The green and red data points at stage 11 represent LiCl-treated and DMSO control LF embryos, respectively.

