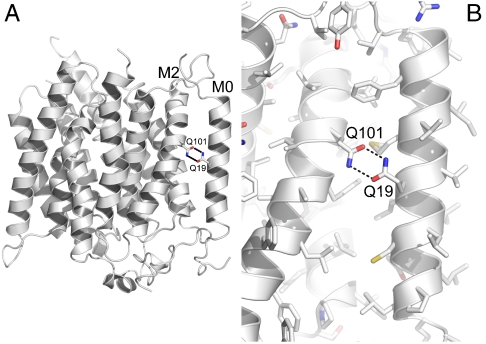
Fig. 2.
The “M0 lock” in RhCG. (A) Cartoon representation of RhCG rendered in PyMol (20). The side chains of Q19 on M0 and Q101 on M2 are shown as stick representation colored by atom type. The hydrogen bonding between the side chains are indicted by dashed lines. (B) Closer view of the M0 lock with all side chains displayed as sticks and colored by atom type (C: white; O: red; N: blue; S: yellow).

