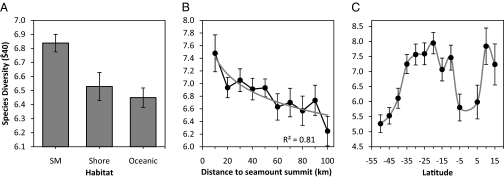
Fig. 1.
Mean expected species diversity (±95% confidence limits) rarefied from 40 individuals (Ŝ40) as a function of (A) the main habitat [seamount (SM), shore and oceanic] where all means are significantly different at α = 0.01 (ANOVA and Tukey's honestly significant difference test), (B) distance to seamount summit where the fitted logarithmic regression is also shown (shaded line), and (C) 5 ° latitude.

