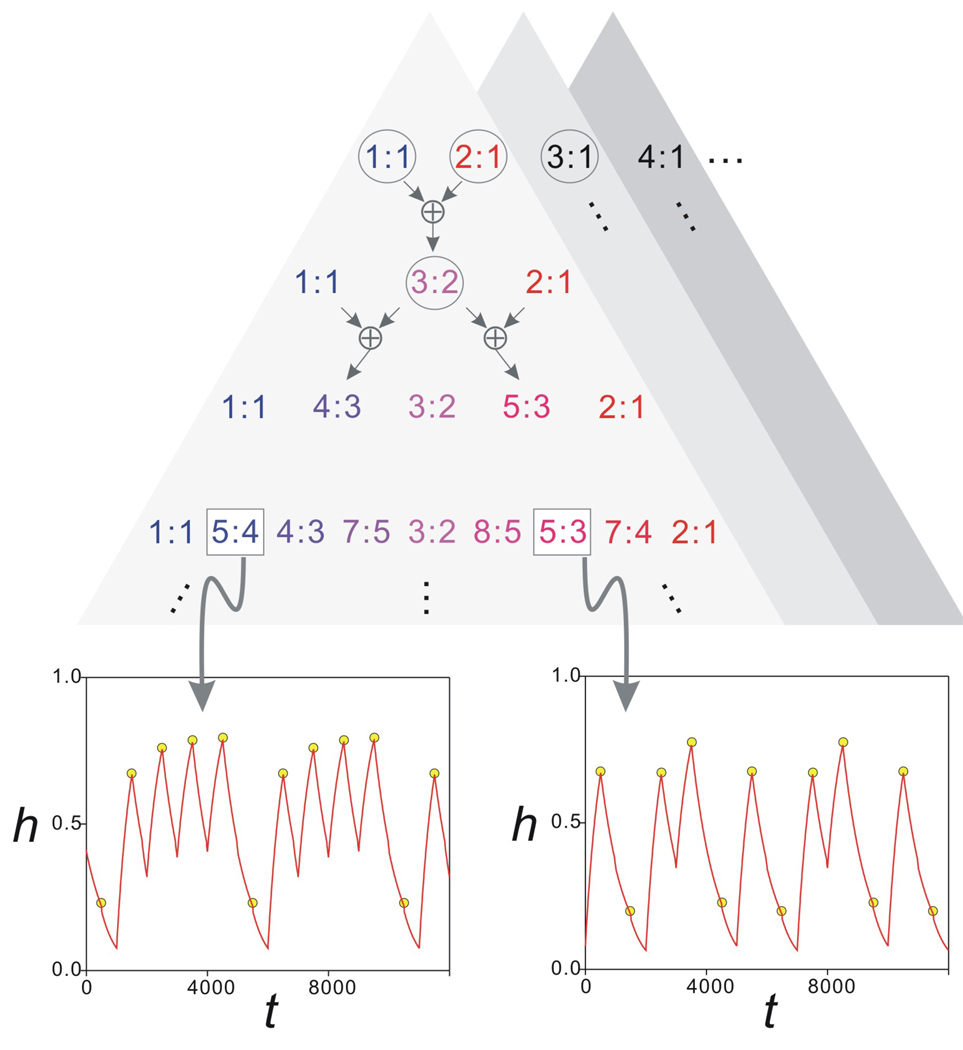
Figure 10.
The generalized Pascal triangle shows the proposed bifurcation structure of the map Π for the parameter gA. The top level shows the stable solutions that cover the largest intervals of gA values. These are the intervals marked as 1–4 in Fig. 7. For all n, the gA interval between the n:1 and n+1:1 solution intervals gives rise to a distinct generalized Pascal triangle (shaded triangles). Each level of the triangle is obtained by adding the adjacent n:m values on the level above using the ⊕ addition operator (top arrows; see text). Only the triangle corresponding to the region between the 1:1 and 2:1 intervals is shown in some detail. The circled n:m values correspond to the solutions shown in Fig. 8. The two insets show two period-five stable solutions of the map Π (yellow circles) superimposed on the time trace of h from Equations (1) (red traces) for the same values of gA indicating the 5:4 (gA=4.63 nS) and 5:3 (gA=5.506 nS) solutions. Other parameters are as in Fig. 8.

