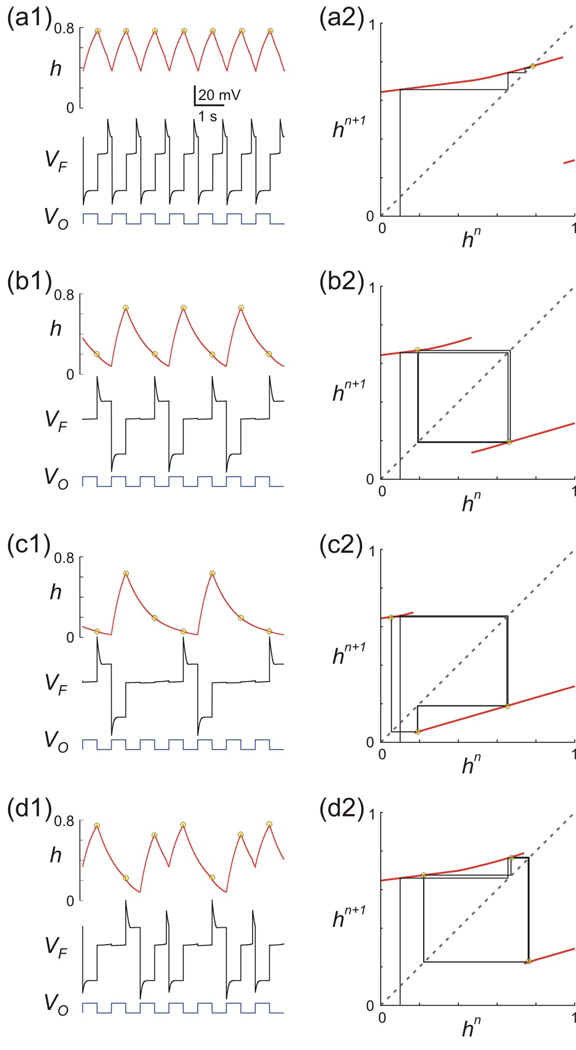
Figure 8.
Numerical simulation of Equation (1) (panels a1-d1) and the analytic solutions of the map Π (panels a2-d2 with arbitrary initial condition of hn=0.1) for different values of gA corresponding to the points marked as a–d in Fig. 7A. (a)–(c) Solutions shown of gA (4, 8 and 20 nS, respectively). The periodic solution changes from 1:1 to 2:1 and then 3:1, corresponding to regions 1, 2 and 3 in Fig. 7. (d) For values of gA between the 1:1 and 2:1 solutions (i.e. between a and d), different types of solutions arise which are not n:1. The case shown with gA = 5 nS indicates a 3:2 solution. Yellow circles in the h trace in a1–d1 denote the steady state values of hn, also seen in the stable solutions of the map Π in a2–d2. Other parameters used: (in ms) Tin = Tact = 500, τhl= 495, τhm = 810, τhh = 500; (in mV) vθ = −6, EL = −60, ECa = 120, vCa = −1.2, kCa = −18, EK = −84; (in nS) gL = 2, gCa = 4, gK = 8; (in pA) Iext = 75; wFP = 0.

