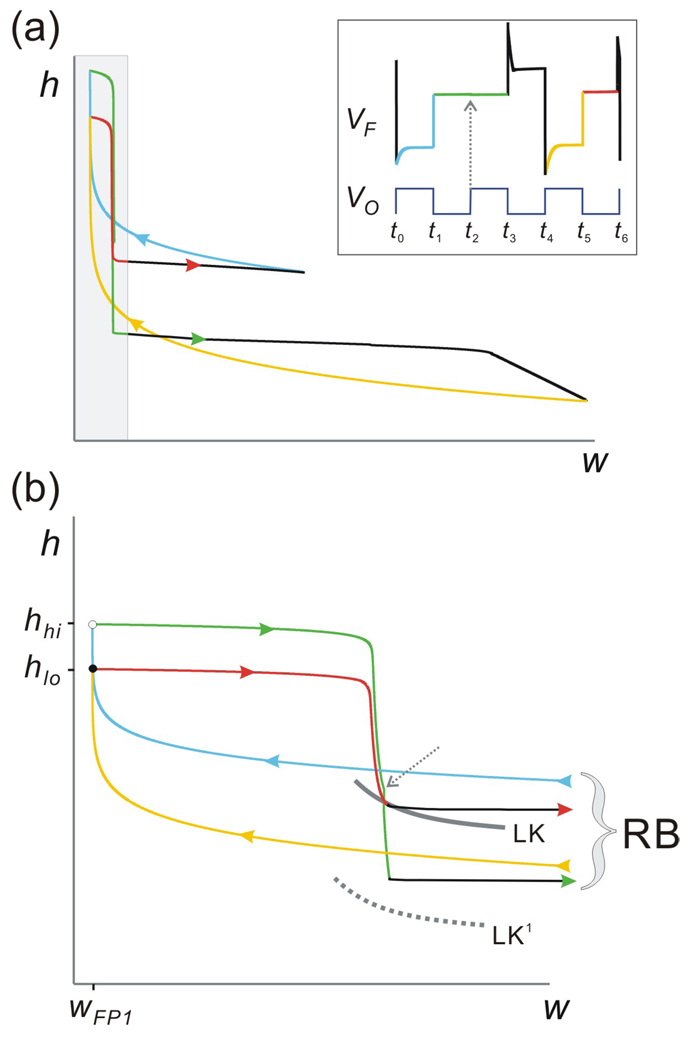
Figure 9.
The 3:2 trajectory on the w-h phase plane. (a) The 3:2 periodic trajectory of F projected on the w-h phase plane shows two periodic loops indicating that the trajectory can be thought of as a combination of a 1:1 and a 2:1 solution. Different colors match the distinct sections of the trajectory on LB (blue and yellow), MB (green and red) and RB (black) as shown in the voltage trace of F (inset; same trace as in Fig. 8(d1)). (b) Blow-up of the shaded region in panel (a). White and solid circle indicate the landing points of trajectory on MB. Dashed grey arrow shows the time t2 at the onset of inhibition from O, indicating that the green trajectory on MB has not reached the jump curve LK (which now shifts to LK1 until the end of inhibition at t3) and is therefore stuck on MB for this cycle of inhibition.

