Fig. 2.
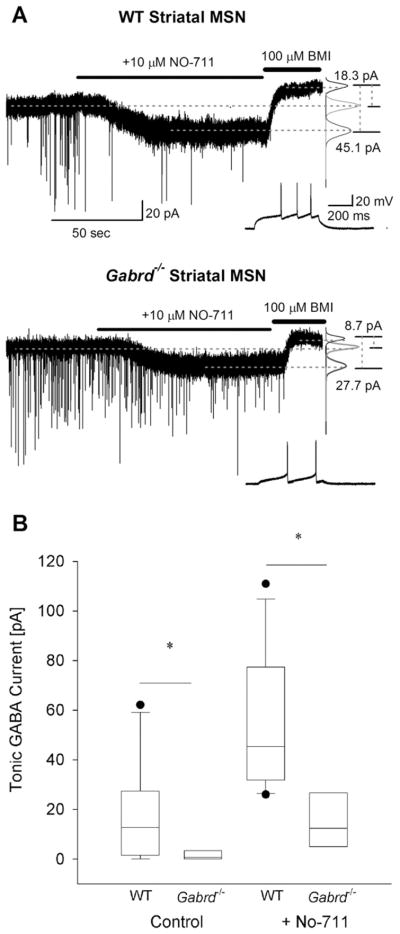
Tonic GABA currents are decreased in Gabrd−/− mice lacking GABAA receptor delta subunits. (A) Example voltage-clamp traces from striatal MSNs in adult wild-type (above) and Gabrd−/− mice (below) show the difference in tonic GABA currents in control conditions and in the presence of NO-711 (10 μM) between the two genotypes. Recordings were obtained at a holding potential of −70 mV. To the right are panels showing Gaussian fits to all-points histograms derived from 30 s recording periods in control conditions and in the presence of NO-711 (10 μM) and a 15 s recording period during the perfusion of BMI used to determine the tonic current. The difference currents are noted to the right were calculated from the Gaussian means indicated by the dashed lines. Inset shows the characteristic firing pattern of the MSNs recorded in response to a depolarizing current injection (+80 pA in the WT in the upper panel and +20 pA in Gabrd−/− in the lower panel) from a holding potential of −70 mV. (B) Summary box-plot shows the decrease in tonic GABA currents in MSNs from Gabrd−/− mice in the absence and presence of NO-711. The upper and lower sides of the box represent the upper/lower quartiles and the median value is represented as a line. The maximum and minimum values are represented by the extent of the whiskers with outliers shown as black dots. Asterisk denotes a statistically significant (P<0.05) difference in mean values using Student’s t-test. Recordings were obtained in the presence of glutamate receptor blockers and 5 μM GABA.

