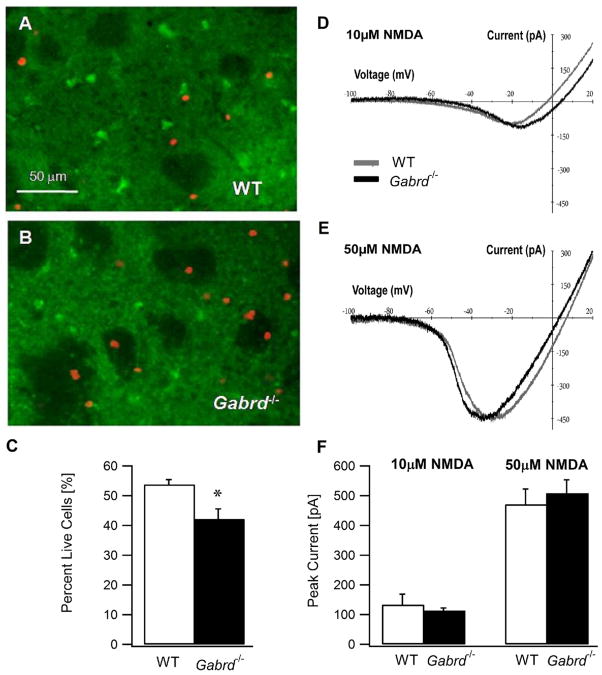
Fig. 4.
Enhanced susceptibility of striatal MSNs in Gabrd−/− mice to excitotoxic cell death. (A, B) Confocal photomicrograph of cortico–striatal slices from a wild-type mouse (A) and a Gabrd−/− mouse (B) showing the assay for live and dead cells following in vitro exposure to quinolinic acid (0.5 mM, 1 h). The live cells are stained with Calcein (in green) and dead cells incorporate the nuclear stain Ethidium Homodimer-1 (in red). Both Calcein and Ethidium Homodimer-1 images of a given field of view were obtained at 10× using appropriate filters and overlaid for illustration. (C) Summary data show the percent of MSNs that survive an hour long in vitro exposure to the excitotoxin quinolinic acid (0.5 mM) in wild-type and Gabrd−/− mice. (D, E) Representative NMDA current–voltage plots obtained in MSNs from adult wild-type and Gabrd−/− mice illustrate comparable peak NMDA currents and voltage-dependence in the presence 10 μM (D) and 50 μM (E) NMDA. (F) Summary histogram shows that the peak NMDA currents are similar in MSNs of wild type and Gabrd−/− mice. Asterisk denote a statistically significant (P<0.05) difference.

