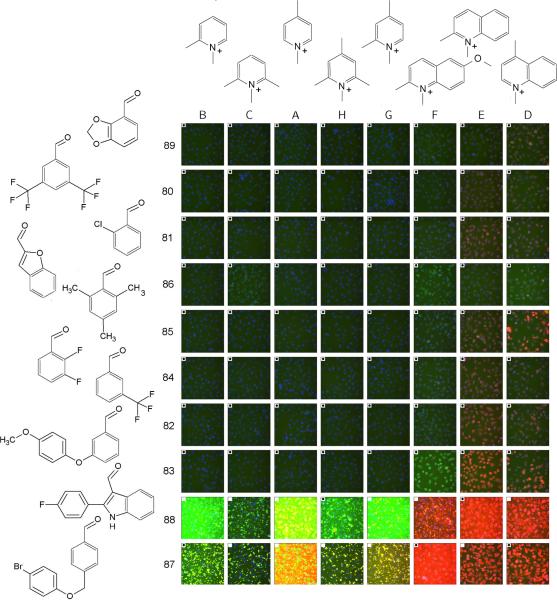
Figure 2.
Array of images acquired from styryl compounds, sorted based on the regression effects of different aldehyde building blocks (rows) and pyridinium/quinolinium building blocks (columns) to the total intensity feature of the styryl molecules. The effect increases from left to right for the pyridinium/quinolinium building blocks, and top to bottom for the aldehyde building blocks. Each image is a color composite of the signal obtained from the Hoechst™ channel (blue), FITC channel (green) and TRITC channel (red). For this figure, the images shown were acquired in the presence of the styryl molecules in the extracellular medium, so some of the images have high background fluorescence. A white, filled square in the upper left hand corner of an image indicates that the image was not used to train the regression model. For display purposes, the images were grouped into an array, and the array of images was then scaled (as a whole) to preserve the relative differences in the staining intensity of each probe.

