Figure 8.

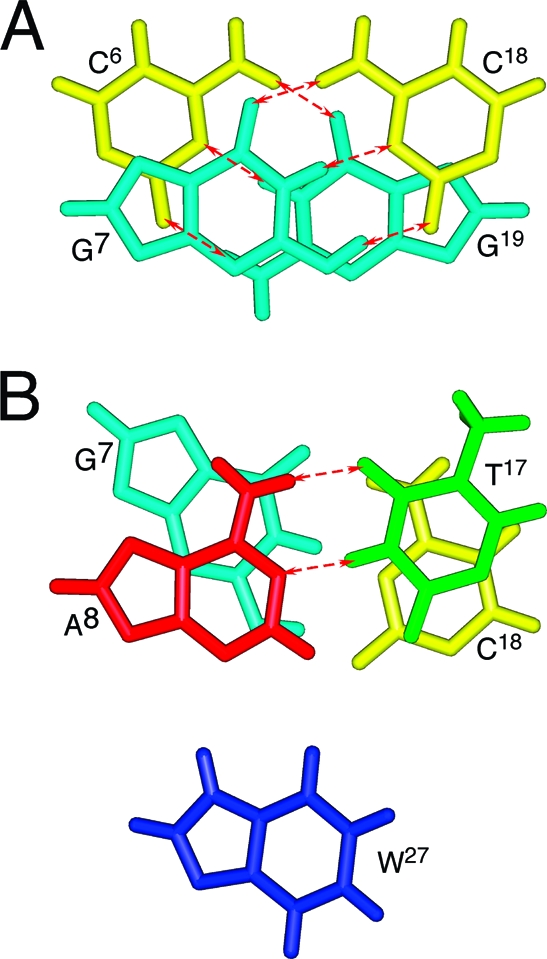
Base stacking of the average structure showing Watson−Crick hydrogen bonds at the KWKK conjugate region. Red arrows represent the Watson−Crick hydrogen bonds.

Base stacking of the average structure showing Watson−Crick hydrogen bonds at the KWKK conjugate region. Red arrows represent the Watson−Crick hydrogen bonds.