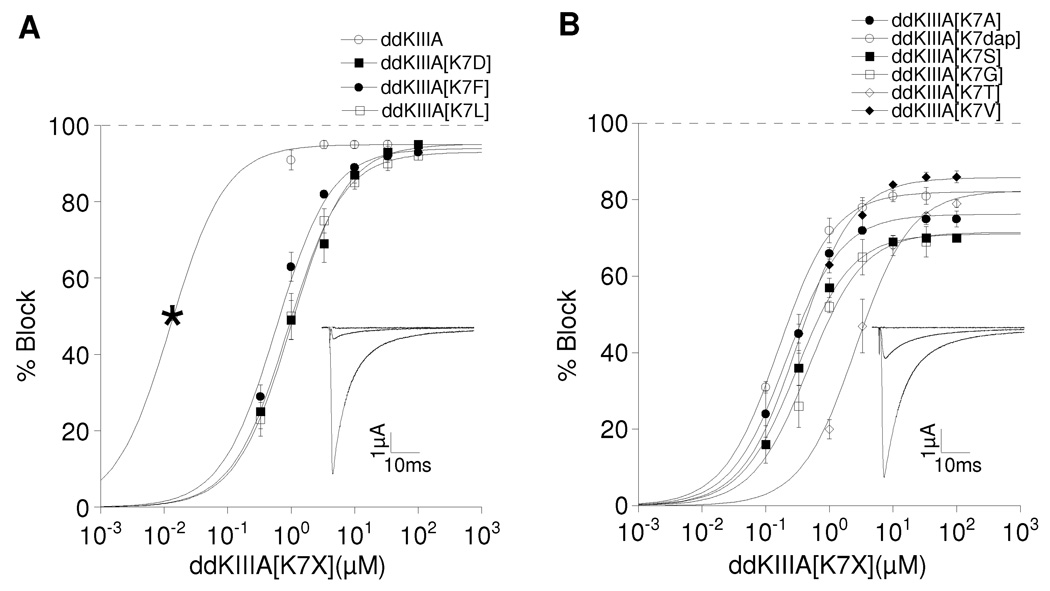
Figure 2.
Saturating concentrations of ddKIIIA or ddKIIIA[K7X] block NaV1.2 incompletely. Oocytes were voltage-clamped as described in Materials and Methods and exposed to peptide until steady-state block of sodium currents was achieved. Superimposed plots of analogs with: A, small (5 – 7%) rINa, where X = K, D, F, or L; and B, large (14 – 30%) rINa, where X = A, S, G, T, V or dap (diaminoproprionate). Asterisk in A (left-most data point for ddKIIIA) represents Kd, calculated from koff/kon (Table 1), since slow rates of block by ddKIIIA in that range of concentrations precluded accurate measurement of steady-state levels of block. Data points represent mean ± S.D. (N ≥ 4). Solid curves represent fit of data (including asterisk) to the equation for the Langmuir adsorption isotherm, Y = 100 • plateau/[1+ (IC50/[peptide])]. IC50 and plateau (i.e., rINa) values are listed in Table 1. The insets show representative traces in response to a depolarizing step to −10 mV from a holding potential of −80 mV before (control, large trace), in the presence of peptide (attenuated trace) either 10 µM ddKIIIA (A) or 30µM ddKIIIA[K7A] (B), and finally in the presence of both peptide and TTX (flat trace), where residual current that persisted in the presence of peptide was obliterated by TTX (100 and 10 µM in A and B, respectively) (see also Fig. 4C & D). Data in A and B are plotted separately for visual clarity.

