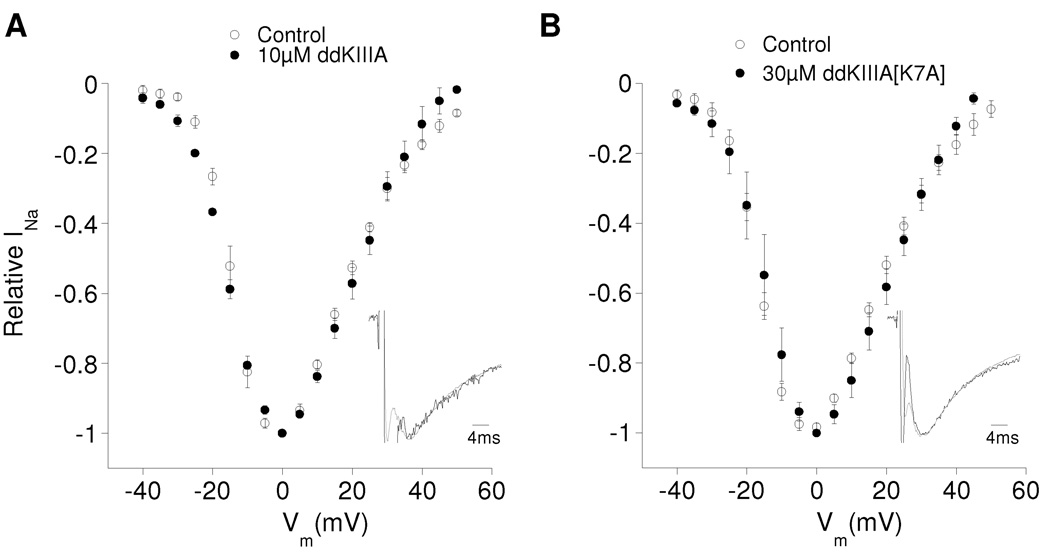
Figure 3.
Kinetics and voltage-dependence of rINa of NaV1.2 with ddKIIIA or ddKIIIA[K7A] are essentially the same as those of control INa. Oocytes expressing NaV1.2 were voltage-clamped and exposed to toxin essentially as in Fig. 2. I-V curves of control INa (closed circles) and rINa (open circles) with ddKIIIA (A) and ddKIIIA[K7A] (B) have essentially the same profile and indicate that the gating properties of the channel were minimally, if at all, affected by the presence of the peptides. To insure that control INa and rINa were obtained with comparable voltage-clamp fidelity, control currents were obtained from oocytes that provided small INa with amplitudes comparable to those of rINa (about 200 and 500 nA for ddKIIIA and ddKIIIA[K7A], respectively). Insets, normalized averaged traces of control INa (gray) and rINa (black) with ddKIIIA (A) and ddKIIIA[K7A] (B) illustrating that rINa and control INa have essentially the same time course (first few ms of the traces represent capacitative transients to be ignored). Data are mean ± S.D. from ≥ 3 oocytes.

