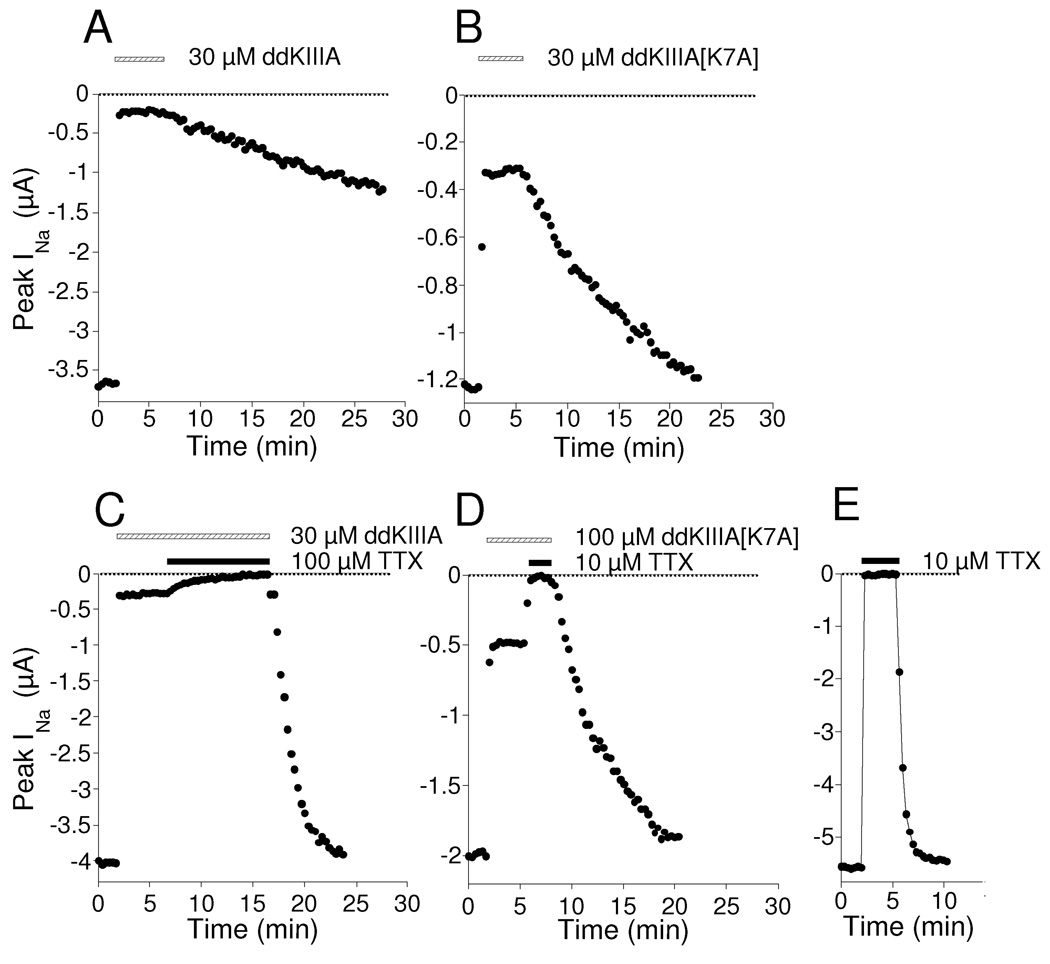
Figure 4.
Kinetics of block of INa of NaV1.2 by ddKIIIA or ddKIIIA[K7A], and kinetics of block of respective rINa's by TTX. Oocytes expressing NaV1.2 were voltage-clamped and current recordings were obtained every 20 s as described in Materials and Methods. Example plot of peak sodium currents (INa) versus time during exposure to and washout of a saturating concentration (30 µM) of ddKIIIA (A) or ddKIIIA[K7A] (B). Block by ddKIIIA and ddKIIIA[K7A] leveled off at <100% (leaving rINa of ~5 and 25%, respectively), and washout of ddKIIIA[K7A] was faster than that of ddKIIIA. The preceding was repeated, except that after steady-state block by each peptide had been obtained, the bath was supplemented with TTX, either 100 or 10 µM with ddKIIIA (C) and ddKIIIA[K7A] (D), respectively. In each case, the rINa was completely blocked by TTX, albeit more slowly than when exposure was to 10 µM TTX alone (E). Following washout of both peptide and TTX, INa fully recovered with a time course faster than that following washout of peptide alone (compare A with C and B with D) but more slowly than that following TTX alone (compare C and D with E). For all panels, presence of TTX is indicated by an closed bar and that of peptide by a open bar. A different oocyte was used to acquire the data for each panel. Rate constants of block of rINa by TTX (kobs) and recovery (koff) for ddKIIIA and all ddKIIIA[K7X] derivatives are summarized in Table 2.

