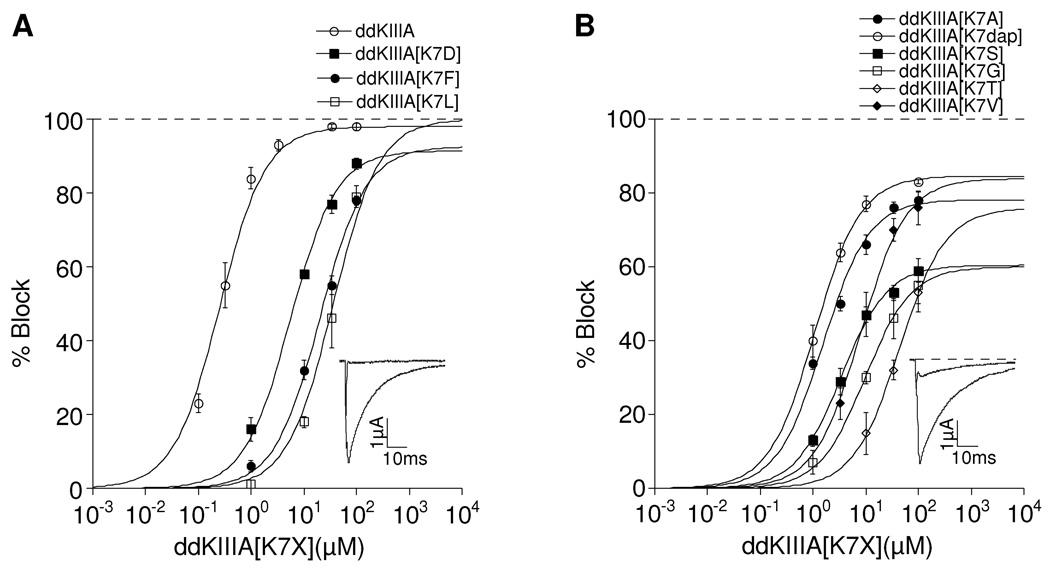
Figure 5.
Saturating concentrations of ddKIIIA and ddKIIIA[K7X] block NaV1.4 incompletely. Superimposed plots of analogs with small (< 9%) rINa, where X = K, D, F, or L (A); and large (16 – 42%) rINa, where X = A, S, G, V, T, or dap (B). Data were acquired and plotted as in Fig. 2. Except for ddKIIIA, data points of peptides do not extend to saturating concentrations because of supply limitations; thus, rINa values were obtained from plateaus extrapolated by curve-fitting. Resulting IC50 and rINa values are listed in Table 3. The insets show representative traces in response to a depolarizing step to −10 mV from a holding potential of −80 mV before (control, large trace), in the presence of peptide (attenuated trace) either 10 µM ddKIIIA (A) or 30 µM ddKIIIA[K7A] (B); the zero-current level is shown by the dashed line in B but not shown in A because the peptide-attenuated current trace would obscure it.

