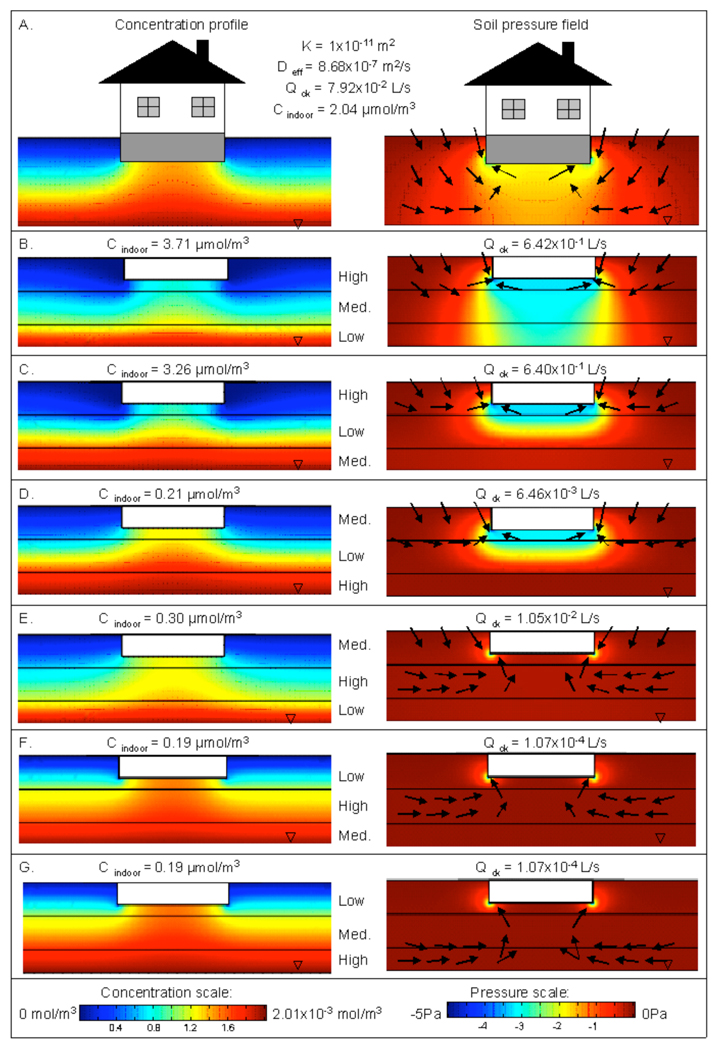
Figure 4.
Soil gas concentration profiles (left hand side) and pressure fields (right hand side) for homogeneous and layered soil scenarios. In this case, the internal building depressurization is assumed to be 5 Pa. In the pressure field plots, qualitative soil gas velocity vectors are shown. Within the structure foundation are indicated the calculated indoor air concentrations (left hand side) and soil gas entry flowrates (right hand side). Panel A. shows results for a homogeneous soil. Panels B. through G. show results for layered soils.

