
Figure 2.
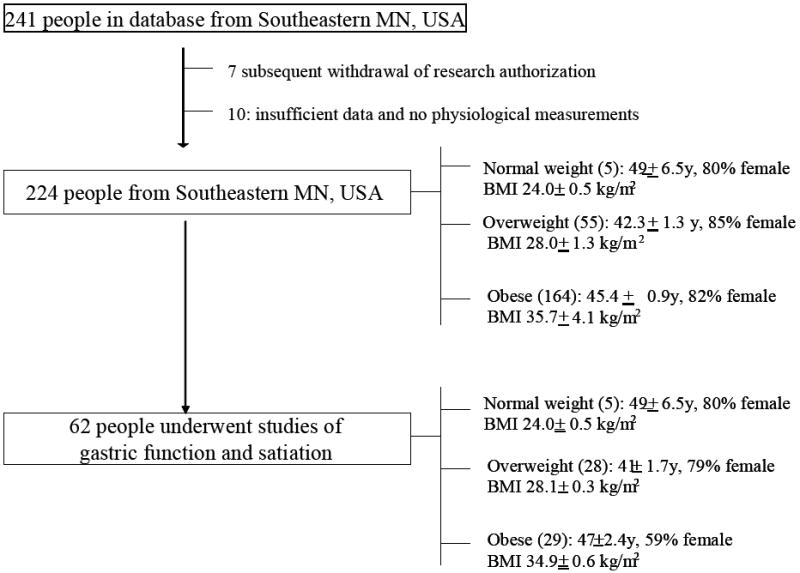
Study flow chart. Note that the age, gender and BMI distributions of the 62 people who underwent intermediate phenotyping were similar to those of the entire cohort of people from southeastern Minnesota, USA.
Official websites use .gov
A
.gov website belongs to an official
government organization in the United States.
Secure .gov websites use HTTPS
A lock (
) or https:// means you've safely
connected to the .gov website. Share sensitive
information only on official, secure websites.
Study flow chart. Note that the age, gender and BMI distributions of the 62 people who underwent intermediate phenotyping were similar to those of the entire cohort of people from southeastern Minnesota, USA.