
Figure 3.
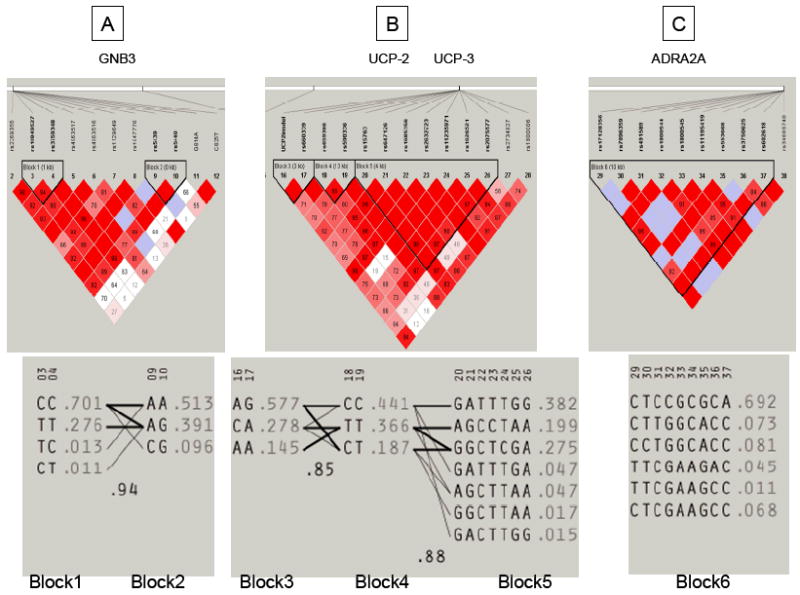
Haploview analysis of haploblocks within the candidate genes studied. Two haploblocks were identified within GNB3 (A), three within the UCP2/UCP3 locus (B) and one within ADRA2A (C). Population frequencies are shown next to each haplotype and lines show the most common crossings from one block to the next, with thicker lines showing more common crossings than thinner lines. Shown beneath the crossing lines is multi-locus D’.