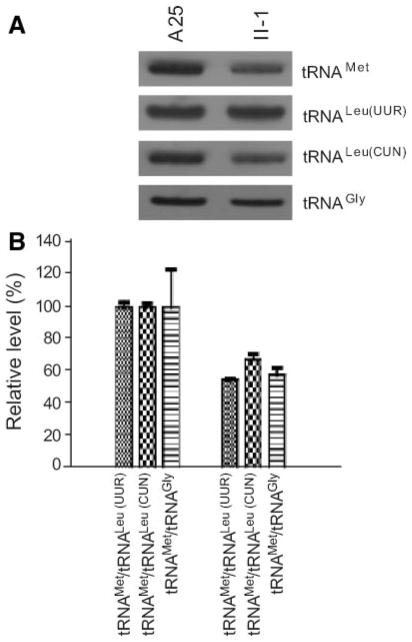
Figure 3.
Northern blot analysis of mitochondrial tRNA. A, Equal amounts (2 μg) of total mitochondrial RNA from various cell lines were electrophoresed through a denaturing polyacrylamide gel, electroblotted, and hybridized with DIG-labeled oligonucleotide probes specific for the tRNAMet. The blots were then stripped and rehybridized with DIG-labeled tRNALur(UUR), tRNAGly, and tRNALeu(CUN), respectively. B, Quantification of mitochondrial tRNA levels. Average relative tRNAMet content per cell, normalized to the average content per cell of tRNAGly, tRNALeu(UUR), or tRNALeu(CUN) in control and mutant cell lines. The values for the latter are expressed as percentages of the average values for the control cell lines. The calculations were based on 3 independent determinations of tRNAMet content in each cell line and 3 determinations of the content of each reference RNA marker in each cell line. Error bars indicate 2 SEMs.

