
Figure 4.
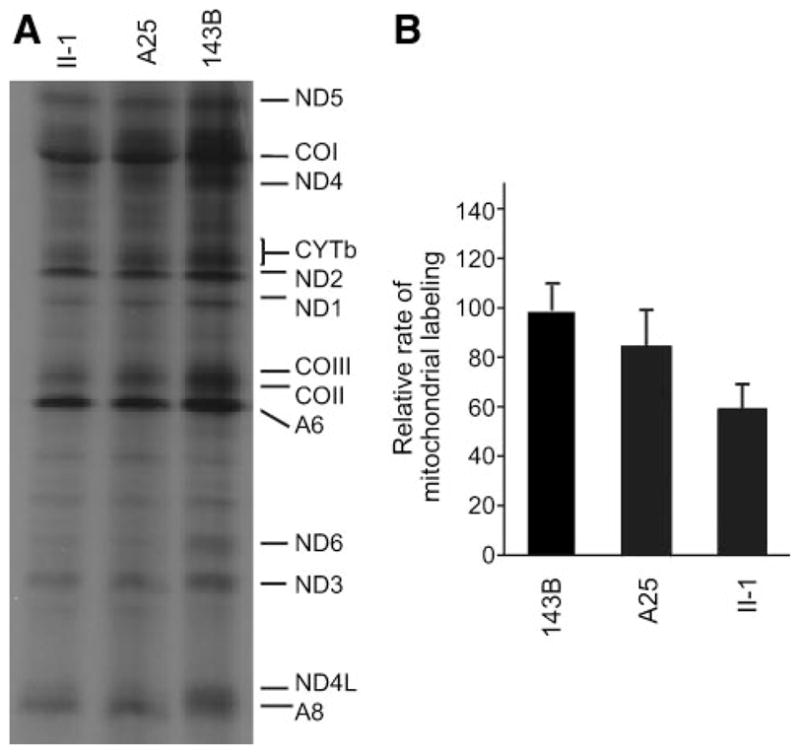
Electrophoretic patterns of the mitochondrial translation products of lymphoblastoid cell lines and of 143B.TK− cells labeled for 30 minutes with [35S]methionine in the presence of 100 μg/mL of emetine. Samples containing equal amounts of protein (30 μg) were run in SDS/polyacrylamide gradient gels. COI, COII, and COIII, subunits I, II, and III of cytochrome c oxidase; ND1, ND2, ND3, ND4, ND4L, ND5, and ND6, subunits 1, 2, 3, 4, 4L, 5, and 6 of the respiratory chain reduced nicotinamide-adenine dinucleotide dehydrogenase; A6 and A8, subunits 6 and 8 of the H+-ATPase; and CYTb, apocytochrome b. B, Quantification of the rates of labeling of the mitochondrial translation products, after a 30-minute [35S]methionine pulse, in lymphoblastoid cell lines. The rates of mitochondrial protein labeling, determined as detailed in Materials and Methods, are expressed as percentages of the value for 143B.TK− in each gel, with error bars representing 2 SEMs. A total of 3 independent labeling experiments and 3 electrophoretic analyses of each labeled preparation were carried out on lymphoblastoid cell lines. The vertical arrows refer to 2 SEs.