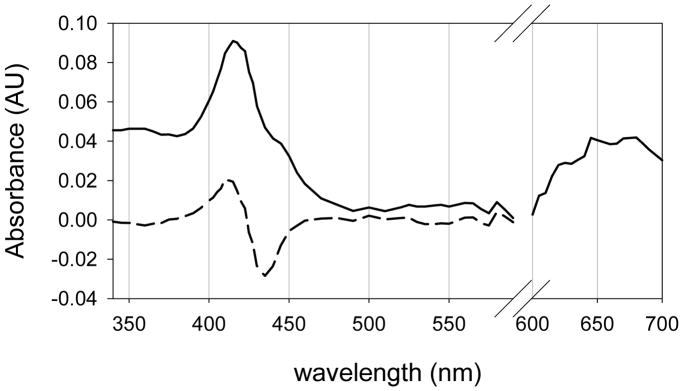
Figure 2.
UV-visible spectrum of CYP119 Compound I. The dashed line is the observed difference spectrum from LFP irradiation of the CYP119 Compound II species. A scaled spectrum of CYP119 Compound II was added to the difference spectrum to produce the spectrum for the Compound I derivative. The Q-band region from 600 to 700 nm is an amplification of an observed difference spectrum with no correction for bleaching.

