
Figure 4.
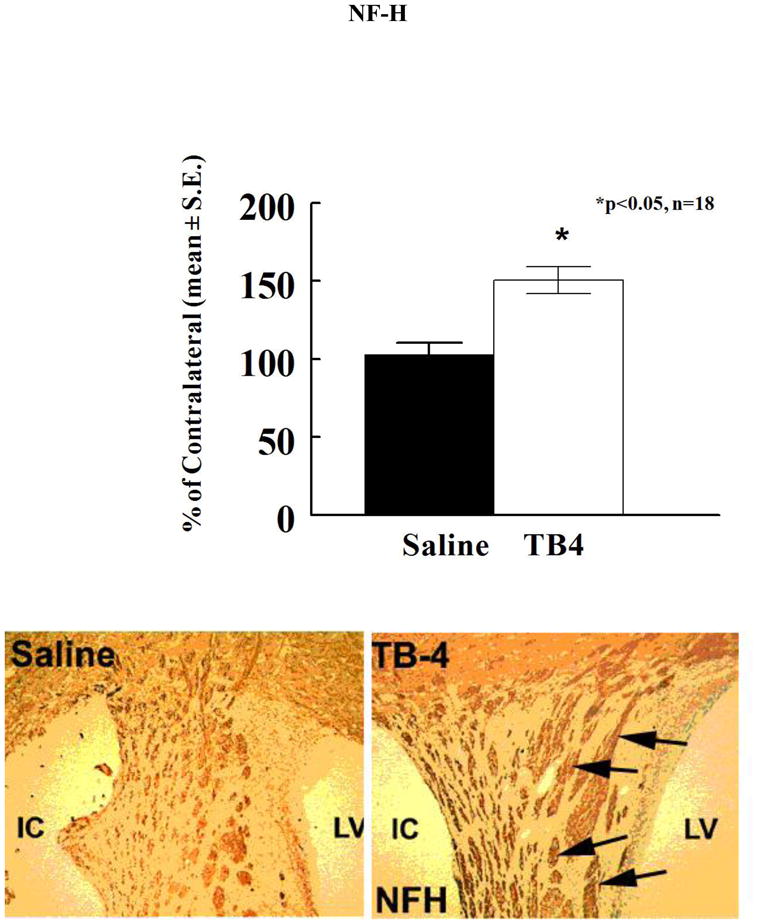
The neurofilament-H (NF-H) shows the axons in the white matter bundles of the striatum of saline and Tβ4 treated rats (see arrows). There is an increased area of staining in the Tβ4 treated rats compared to the saline control. Quantitative data show significantly increased staining in the Tβ4 treated rats compared to the saline control. LV=lateral ventricle and IC=ischemic core