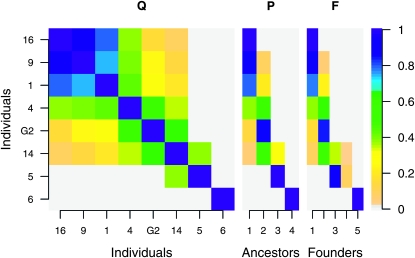
Figure 6.—
Reduced IBD matrix Q and associated descent probability matrices P and F at locus 4, with G2 representing the central block of individuals in Figures 3 and 4. Note that P and F are similar, except for the descent of individuals 5 and 14. Ancestors or founders with a column sum <0.05 are not shown.

