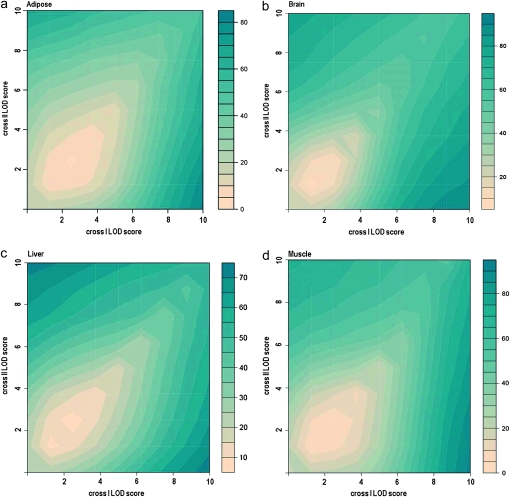
Figure 4.—
Replication of distal eQTL between crosses at different significance thresholds. The percentage of eQTL that replicated between crosses at various LOD thresholds is depicted in (a) adipose, (b) brain, (c) liver, and (d) muscle tissue. The eQTL at LOD > 2.7–10 of the mouse crosses were screened for detection at LOD > 2.7–10 in their respective comparison crosses. The heat map reflects the degree of replication as the percentage of eQTL at various LOD thresholds in cross I that overlap in cross II at various LOD thresholds and vice versa. For example, in adipose tissue (a), ∼80% of eQTL at LOD > 2.7 in cross II were detected in cross I (bottom right corner).

