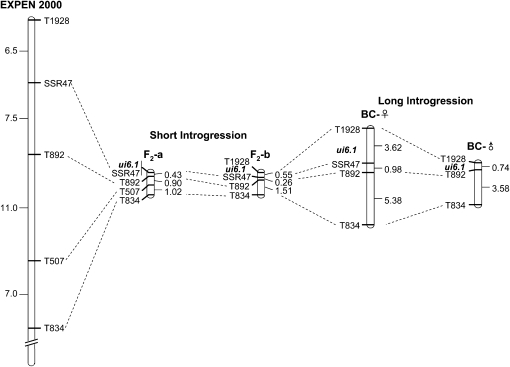
Figure 5.—
Comparison of recombination frequencies near ui6.1 in different mapping populations. The F2 maps are based on recombination within a relatively short (32 cM) S. pennellii segment, whereas the BC maps are derived from a longer segment (∼80 cM) in a substitution line. The reference map is the tomato EXPEN 2000 map (http://solgenomics.net). Genetic distances are in units of percentage of recombination, or, on the EXPEN 2000 map, in centimorgans. On the F2-b and BC maps, ui6.1 is shown at its approximate location because not all plants in these populations were phenotyped.

