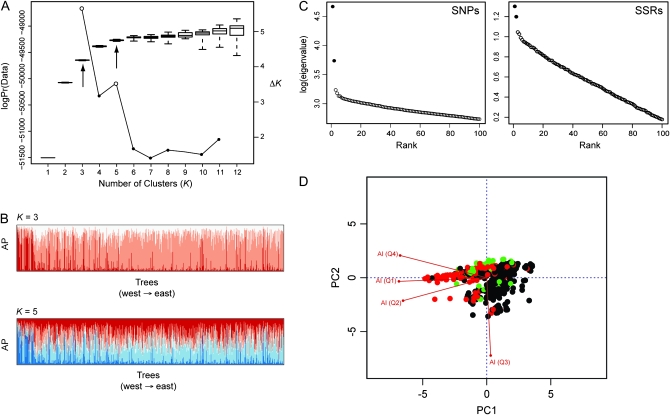
Figure 2.—
Patterns of population structure for loblolly pine are correlated with geography and aridity. (A) The relationship between the log probability of the data and the number of clusters (K) using the SSR data. Arrows denote values of K assumed during further analysis. (B) Assignment probabilities (AP) for trees arranged from west to east assuming K = 3 or K = 5. (C) Screen plots for PCA analysis using SNPs (left) and SSR markers (right). Major eigenvalues are denoted by black circles. (D) A biplot indicating correlations among aridity variables, as well as with population structure. The PCs were derived by PCA on the four aridity indices. Colors denote cluster memberships as determined using PCA on the SNP data.

