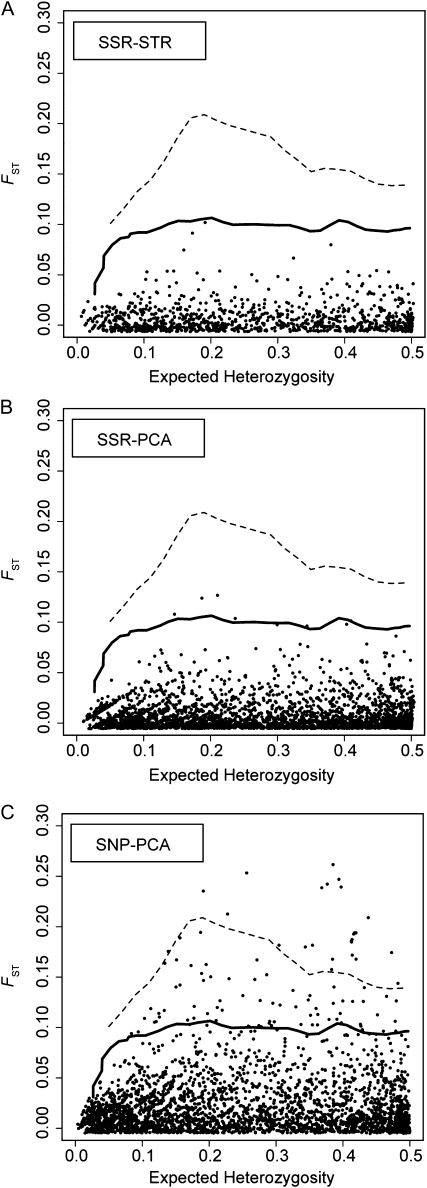
Figure 5.—
The quantity and identity of FST outliers under island and dual Pleistocene refugia models are affected by cluster assignments. Each point represents a SNP locus (n = 3059), with lines denoting the upper 99th percentile of the null distribution (solid: island model; dashed: two-refugia model). Each plot represents a different set of cluster assignments based on differing marker sets for K = 3. (A) Cluster assignments from STRUCTURE based on SSR markers. (B) Cluster assignments from PCA using SSR markers. (C) Cluster assignments from PCA using SNP markers.

