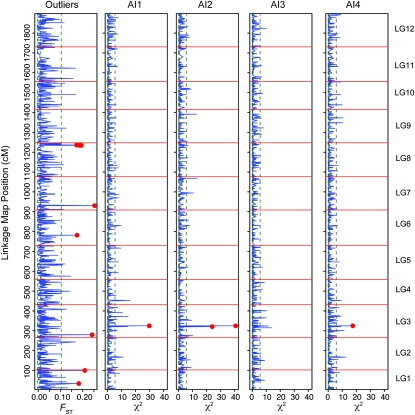
Figure 6.—
Loci associated with aridity and those identified as FST outliers are distributed across the linkage map of loblolly pine. Plotted are trend lines across the 1898-cM linkage map for FST and χ2 statistics for four aridity indices (AI1, AI2, AI3, and AI4). Red circles denote significant outliers (n = 11) or associated SNPs (n = 2), while dashed green lines denote the 2.5%, 50%, and 97.5% quantiles of the genomic distribution for each statistic. Three of the five SNPs associated significantly to aridity were not segregating within the cross that was used to construct the linkage map and are thus unmapped.

