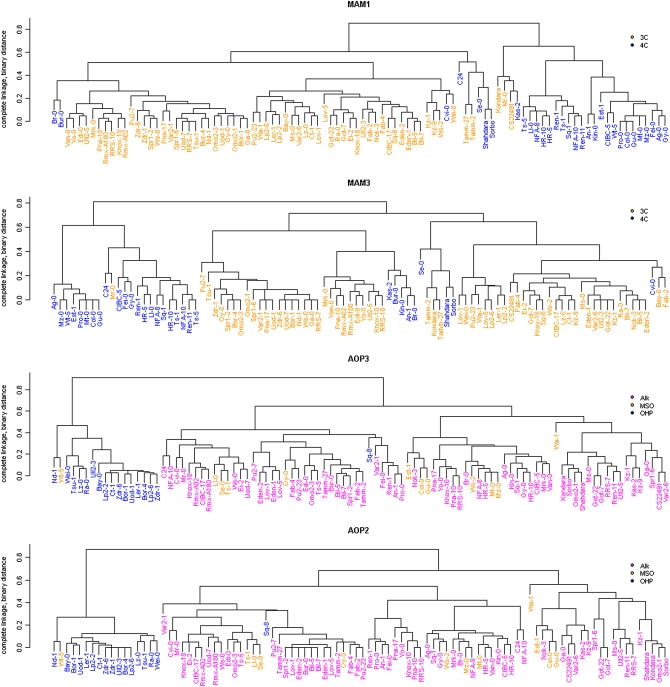
Figure 8.—
Cladograms of accessions at the AOP and MAM loci. Cladistics relationships were determined using 82 (MAM1), 45 (MAM3), 139 (AOP3), and 88 (AOP2) SNPs within the identified LD blocks of the respective loci. Pairwise SNP distances were estimated with Jaccard's similarity coefficient by representing genotypes as 0 (major allele) and 1 (minor allele) and the cladogram constructed using complete linkage hierarchical clustering. In the MAM cladograms, accessions favoring the production of 3-carbon GSL are shown in orange and those favoring 4-carbon GSL are shown in blue. For the AOP2/3 cladograms, accessions that predominantly produce alkenyl, methylsulfinyl, or hydroxypropyl GSL are colored red, orange, and blue, respectively.

