
Figure 6.
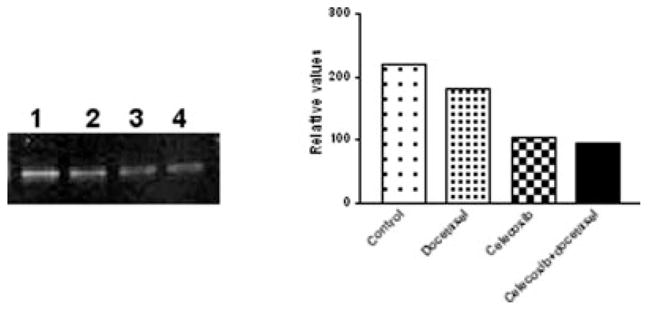
RT-PCR of mPGE synthase in tumor tissues. Lanes 1–4 represent control, docetaxel, celecoxib and celecoxib with docetaxel combination treatments, respectively. The tumor tissues were harvested 28 days post-tumor implantation and processed for RT-PCR as described in Material and Methods. The mPGE synthase product size (459 bp) was determined using a 100–2680 bp DNA ladder (Fisher Scientific Co., Atlanta, GA).