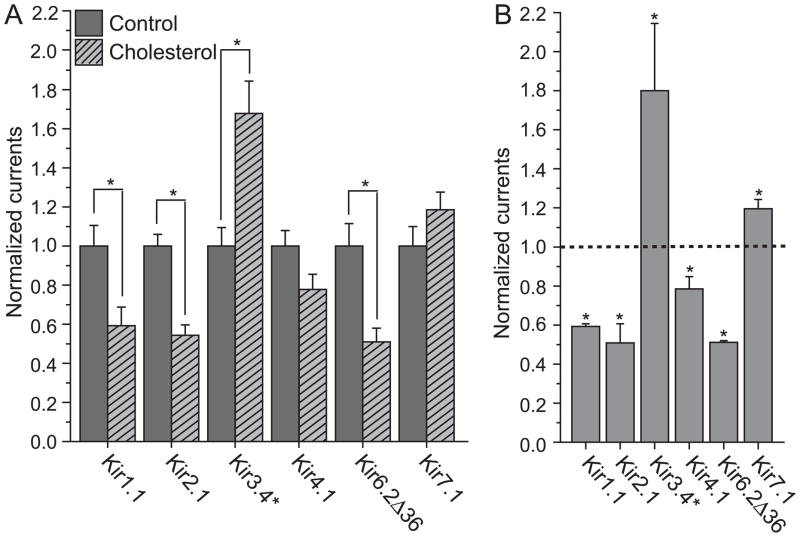
Figure 1. Effect of cholesterol enrichment on Kir channels.
A. Whole cell basal currents of control and cholesterol-enriched Xenopus oocytes injected with Kir channels. Expression of channel proteins in oocytes was accomplished by injection of the following amounts of cRNA per oocyte: Kir1.1 and Kir7.1: 5ng; Kir2.1: 0.5ng; Kir3.4* and Kir6.2Δ36: 2ng; Kir4.1: 1ng. Two-electrode voltage clamp recordings were performed 1(for Kir2.1) −2 (for all other channels) days after injection. Oocytes injected with Kir6.2Δ36 were treated with 3mM NaAzide for 5min prior to recording. High-potassium solution was used to superfuse oocytes (in mM: 96 KCl, 1 NaCl, 1 MgCl2, 5 HEPES-KOH buffer, pH 7.4). Basal currents represent the difference of inward currents obtained at −80 mV in the presence of 3 mM (or 10mM for Kir7.1) BaCl2 in high-potassium solution from those in the absence of Ba2+. 2–6 batches of oocytes were tested for each normalized recording shown as detailed in the figure caption of Fig. 1B. For each construct, the total number of [control, enriched] oocytes tested was: Kir1.1 [19,20], Kir2.1 [64,52], Kir3.4* [45,33], Kir4.1 [28,26], Kir6.2Δ36 [15,10] and Kir7.1 [25,15]. Recordings from different batches of oocytes were normalized to the mean of whole-cell basal currents obtained from control untreated oocytes. Statistics (i.e., mean and standard error) of each construct were calculated from all of the normalized data recorded from different batches of oocytes. B. Average of normalized mean of whole-cell basal currents obtained from different batches of cholesterol enriched oocytes. The number of [batches] tested was: Kir1.1 [3], Kir2.1 [6], Kir3.4* [5], Kir4.1[4], Kir6.2Δ36 [2] and Kir7.1 [4]. The mean of each batch of control untreated oocytes was normalized to one, and therefore the average of the means of all batches of untreated oocytes was one, which is represented by the dashed line in the figure. The averages of all cholesterol enriched batches of oocytes were significantly different than one, as indicated by the asterisk (*p < 0.05).

