
Figure 2. Effect of mutation in the CD loop of Kir2.1 and Kir3.4* on cholesterol sensitivity of the channels.
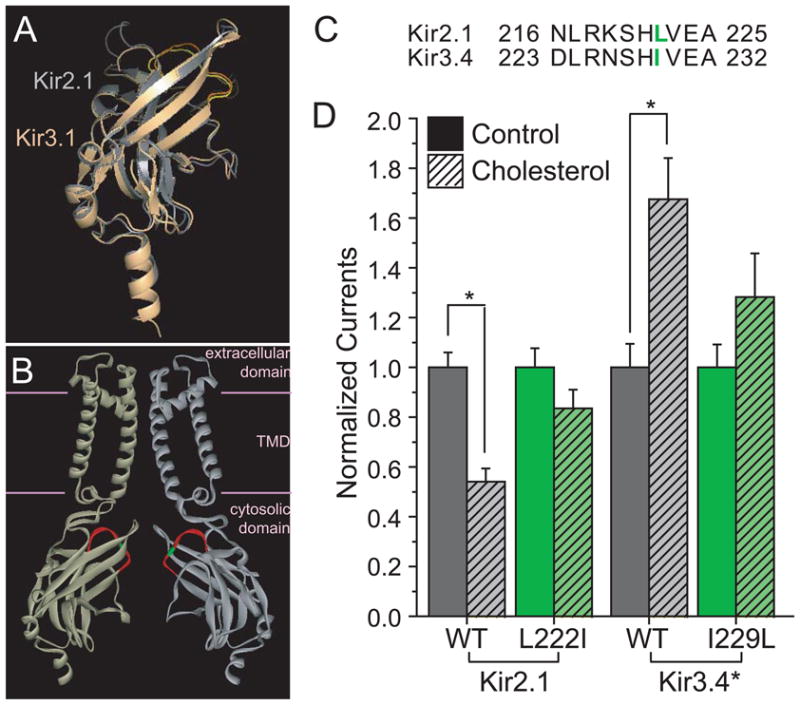
A. Structural alignment of the crystallographic structures of the cytosolic domains of Kir2.1 and Kir3.1. The Root Mean Square Deviation (RMSD) between the structures of the cytosolic domains of Kir2.1 (gray) (PDB accession no. 1U4F) and Kir3.1 (light orange) (PDB accession no. 1U4E) is only 1.1Å despite a sequence identity of only 54.2%. The CD loop is colored yellow in Kir2.1 and orange in Kir3.1. B. Homology model showing two opposite facing subunits of Kir2.1. The CD loop is colored red and the position of L222 is highlighted green. Due to the high structural similarity between the cytosolic domains of Kir2 and Kir3 channels as depicted in Fig. 2A, I229 in Kir3.4* would be located at approximately the same position. The structure shown is a homology model based on the cytosolic domain of Kir2.1 (PDB accession no. 1U4F) and the TMD of KirBac3.1 (PDB accession no. 1XL4). C. Alignment of the CD loop residues in Kir2.1 and Kir3.4. The residues included in the alignment correspond to the segment highlighted red in Fig. 2B, the CD loop. L222 in Kir2.1 and I229L in Kir3.4 are colored green and correspond to the residue highlighted in green in the homology model, Fig. 2B. D. Effect of CD-loop residue on the sensitivity to cholesterol of Kir2.1 and Kir3.4*. Whole cell basal currents of control and cholesterol-enriched Xenopus oocytes injected with Kir2.1, its L222I mutant, Kir3.4* and its I229L mutant. The recordings were obtained as described in the Figure caption of Fig. 1A. For each construct, the total number of [control, enriched] oocytes tested was: Kir2.1 [64,52], Kir2.1_L222I [35,32], Kir3.4* [45,33], Kir3.4*_I229L [17,12]. Number of [batches] tested: Kir2.1 [6], Kir2.1_L222I [4], Kir3.4* [5], Kir3.4*_I229L [3]. Significant difference is indicated by the asterisk (*p < 0.05).