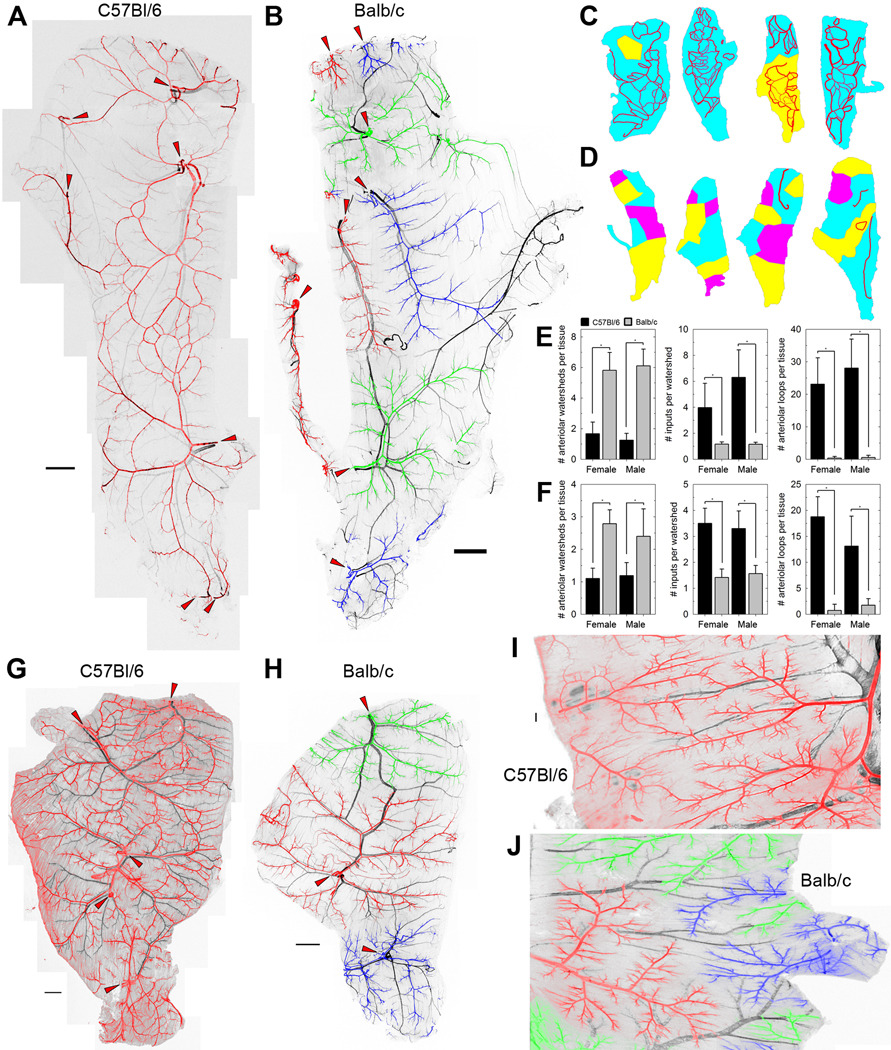
Figure 1. Arteriolar and venular networks in mouse skeletal muscle.
A and B, Typical spinotrapezius muscles of C57Bl/6 and Balb/c mice, immunofluorescently stained for smooth muscle α-actin. Veins are shown in black; arterioles are pseudocolored red, green or blue, with adjacent connected arteriolar trees having the same color. Nonadjacent arteriolar trees of the same pseudocolor are not connected at the arteriolar level within the tissue; that is, each of the green, blue and red arteriolar trees are distinct from one another. The arteriolar inputs into the muscle are indicated by red arrowheads. Higher-resolution versions are given in Supplemental Figures S2 and S3. C and D, Variability in the watersheds and arteriole-to-arteriole collaterals of C57Bl/6 (C) and Balb/c (D) spinotrapezius muscles. Watersheds are defined as volumes of tissue that are fed by a single arteriolar network, pseudocolored as the networks are in A. Arteriolar-level connections between the arteriolar trees downstream of the multiple arteriolar inputs into the tissue are shown in red. E and F, Quantification of the morphological differences in spinotrapezius (E) and latissimus dorsi (F) arteriolar structure of the mouse strains. The metrics that best differentiate the strains are the number of arteriolar inputs that supply each watershed (a measure of the interconnectedness of the arteriolar trees) and the presence of arteriolar loop structures within the tissue. n=4–18 per group; *, P<0.001 by ANOVA. G and H, Typical latissimus dorsi muscle of C57Bl/6 and Balb/c mice, stained and pseudocolored as in A and B. The arteriolar inputs into the muscle are indicated by red arrowheads. High-resolution versions are given in Supplemental Figures S4 and S5. I and J, Comparable regions of typical thoracic diaphragm muscles of C57Bl/6 and Balb/c mice, stained and pseudocolored as in A and B. Scale bars for A, B, G, H, 1 mm; scale bar for I, J, 200 µm.

