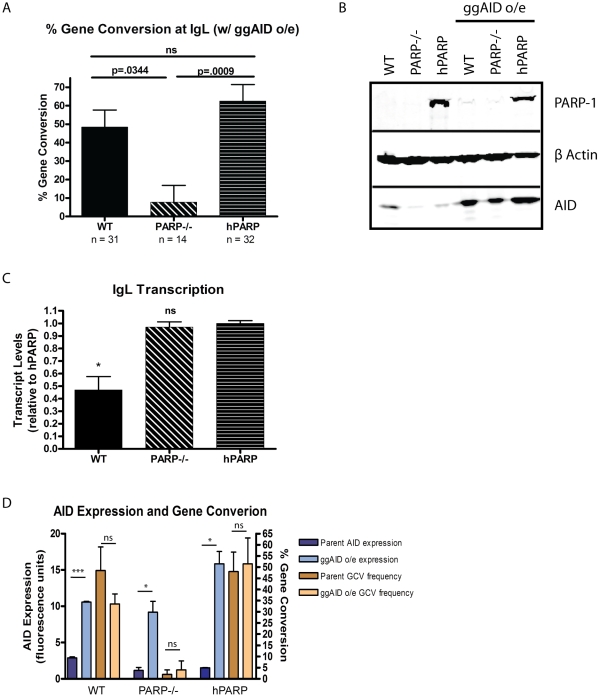
Figure 3. AID overexpression does not restore GCV to PARP-1−/− cells.
(A) Gene conversion frequencies (+/− SEM) in cell lines overexpressing ggAID. n = total number of mutations analyzed for each cell line. The total number of sequences analyzed was 169 WT, 137 PARP-1−/−, and 106 hPARP. (B) Western blot showing increase in AID expression upon transduction with ggAID retrovirus. (C) IgL transcript levels (mean +/− SEM) are similar in cell lines which do and do not support GCV. * p<.05, ns = not significant compared to hPARP. (D) AID expression levels do not directly influence GCV frequencies. Blue bars are AID expression levels (mean +/− SEM) before (dark blue) and after (light blue) transduction with ggAID cDNA as measured by Western blot and quantified by LICOR Odessey infrared imaging, normalized to β actin. Brown bars are GCV frequencies (mean +/− SEM) before (dark brown) and after (light brown) transduction with ggAID cDNA as a percentage of total mutations observed for the indicated cell lines. *** p<.0001, * p<.05, ns = not significant.

