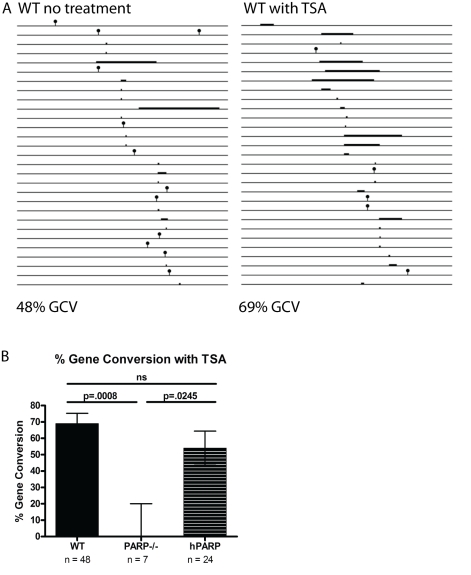
Figure 4. Culture in TSA increases GCV rates at IgL in a PARP-1-dependent fashion.
(A) Line drawing depicting point mutations (lollipops) and gene conversion events (bars) at WT IgL in the absence and in the presence of TSA. (B) Proportion of total mutations that are GCVs in TSA treated cultures. Error bars are (+/−) SEM. n = total number of mutations observed for each cell line.

