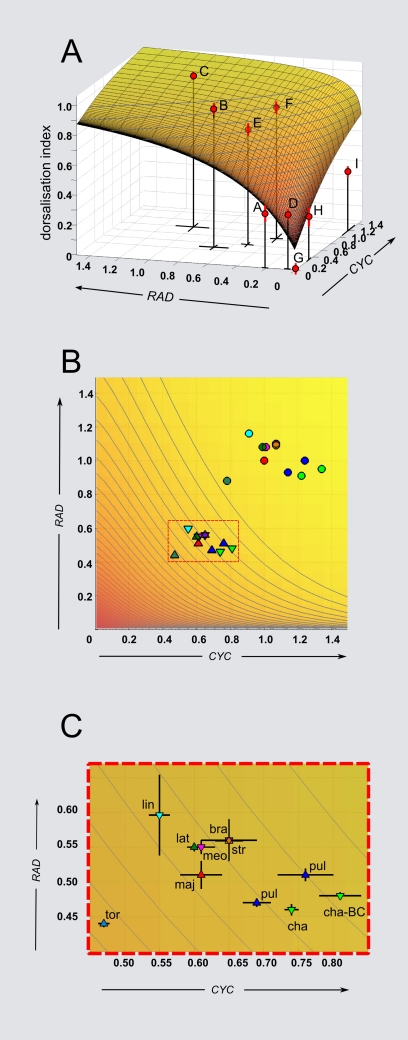
Figure 4. GEM spaces for CYC and RAD, showing location of various genotypes and species.
(A) Dorsalisation index for each position in GEM space using values from Table 1. Standard errors for DI cor and expression levels are shown (if error bars are not visible, they are smaller than the symbols). A smooth surface has been fitted to the data (see Materials and Methods for details of surface fitting). Note that the wild-type, C, lies on a plateau while the double heterozygote, E, is on the slope. (B) Top view of the GEM space, incorporating the relative expression values from the species taken from Figure 1 (circles). These values were adjusted assuming that A. majus (red circle) is at position (1, 1) in gene expression space. Triangles indicate expected gene activity values in the double heterozygote (CYC = x×0.6; RAD = y×0.5; see Table 1E). Some of the double heterozygotes are predicted to have DI values above or below the position of A. majus. Triangles pointing upwards indicate species showing notch phenotype. (C) Enlargement of rectangle in (B). bra, A. braun-blanquetii; cha, A. charidemi; lat, A. latifolium; lin, A. linkianum; maj, A. majus; meo, A. meonanthum; pul, A. pulverulentum; str, A. striatum; tor, A. tortuosum; cha-BC, introgression of A. charidemi into A. majus background.

