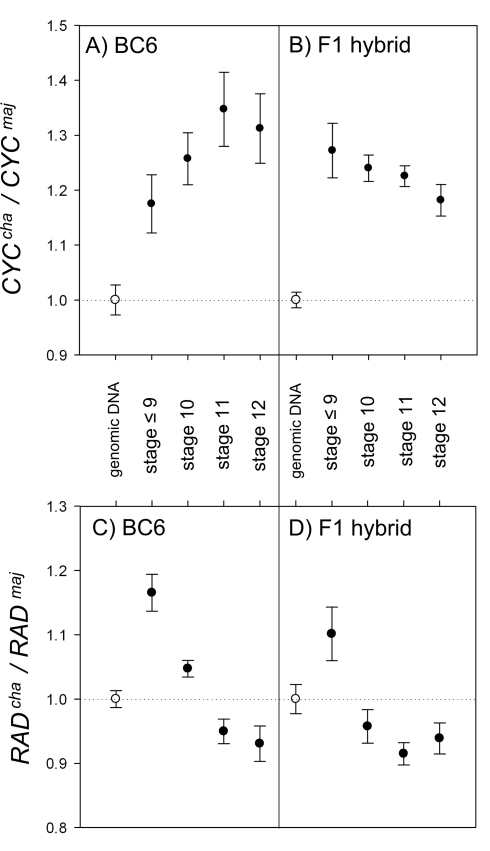
Figure 6. Expression ratios of A. charidemi alleles in various genetic backgrounds.
(A and B) Ratios of CYCcha expression relative to CYCmaj for BC6 (A) and F1 hybrids (B) at various developmental stages. The CYCcha allele is expressed at a higher level than CYCmaj at all stages. (C and D) Ratios of RADcha expression relative to RADmaj for BC6 (A) and F1 hybrids (B) at various developmental stages. RADcha expression was higher than RADmaj only at the earliest developmental stage analysed. Genomic DNA (white circles) was used to calculate PCR amplification biases. Bars, standard error.

