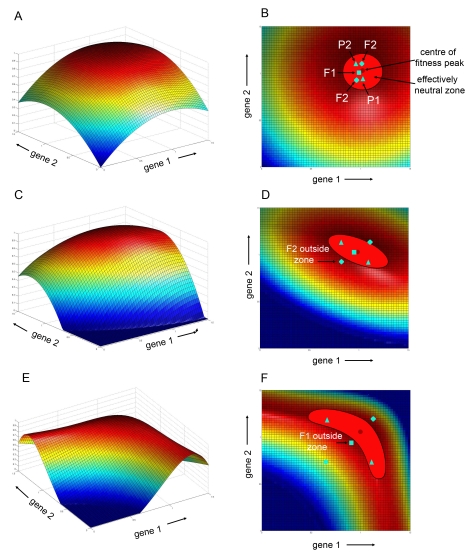
Figure 7. GEF spaces.
Gene expression levels for two genes are plotted along the horizontal plane while fitness is along the vertical axis. (A) Radially symmetrical peak. (B) 2-D Projection of (A) showing location of effectively neutral zone and position of two parental genotypes (P1, P2 triangles), the resulting F1 (square) and additional genotypes observed in the F2 (diamonds). The F1 in this case is nearer to the centre of the peak while the F2s have similar fitness to the parents. (C) Diagonal ridge. (D) 2-D projection of diagonal ridge showing tilted elliptical neutral zone. The F1 is nearer to the peak than the parents but some F2 genotypes may now have lower fitness and fall outside the neutral zone. (E) Curved ridge. (F) 2-D projection of curved ridge showing banana-shaped neutral zone. Some F1 genotypes may have lower fitness and fall outside the neutral zone.

