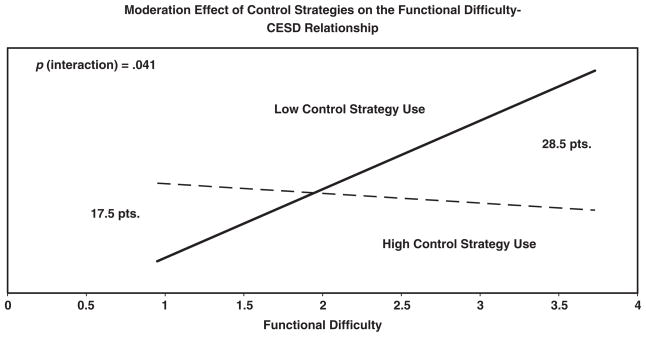
Figure 1.
Moderation effect of control strategies for African-American participants. For the combination of low control strategy use and low difficulty (1.0), the value of the vertical axis is set arbitrarily. This is due to the actual vertical location of scores on the Center for Epidemiologic Studies Depression Scale (CES-D) being dependent on the values of the other covariates (treatment assignment, sociodemographics, baseline CES-D score, functional difficulty, social support, control strategy use, spirituality, and personal agency) in the analysis. The graph correctly represents differences in CES-D scores between high and low strategy users but not an actual CES-D value.

