
Figure 3.
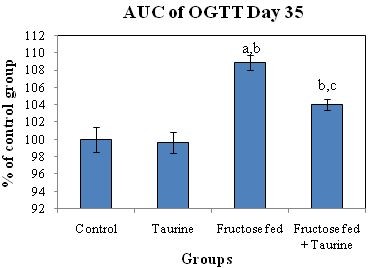
Effect of HFD and taurine supplementation on AUC of OGTT at day 35 of the study. Values are expressed as % of control group. (a) Significant difference from control group at day 35, at P ≤ 0.05. (b) Significant difference from taurine group at day 35, at P ≤ 0.05. (c) Significant difference from fructose-fed group at day 35, at P ≤ 0.05. Using one way ANOVA followed by Tukey test as post hoc test.